
Table of Contents
- Key Takeaways
- 1. Introduction
- 2. CC’s Net Margin Halved As Volume Migrated Into Larger Packs With Thinner House Edges
- 3. Physical Redemptions Consumed 42% Of May Pre-Burn Net Revenue, With 75 Wallets Driving The Burn Activity
- 4. Grading Lanes Tightened, GameStop Entered, And Market-Price Inventory Turns The Model Negative
- 5. The B2B API Strategy Still Has To Prove Repeatability
- 6. Looking Forward
Researcher
Related Projects
Key Takeaways
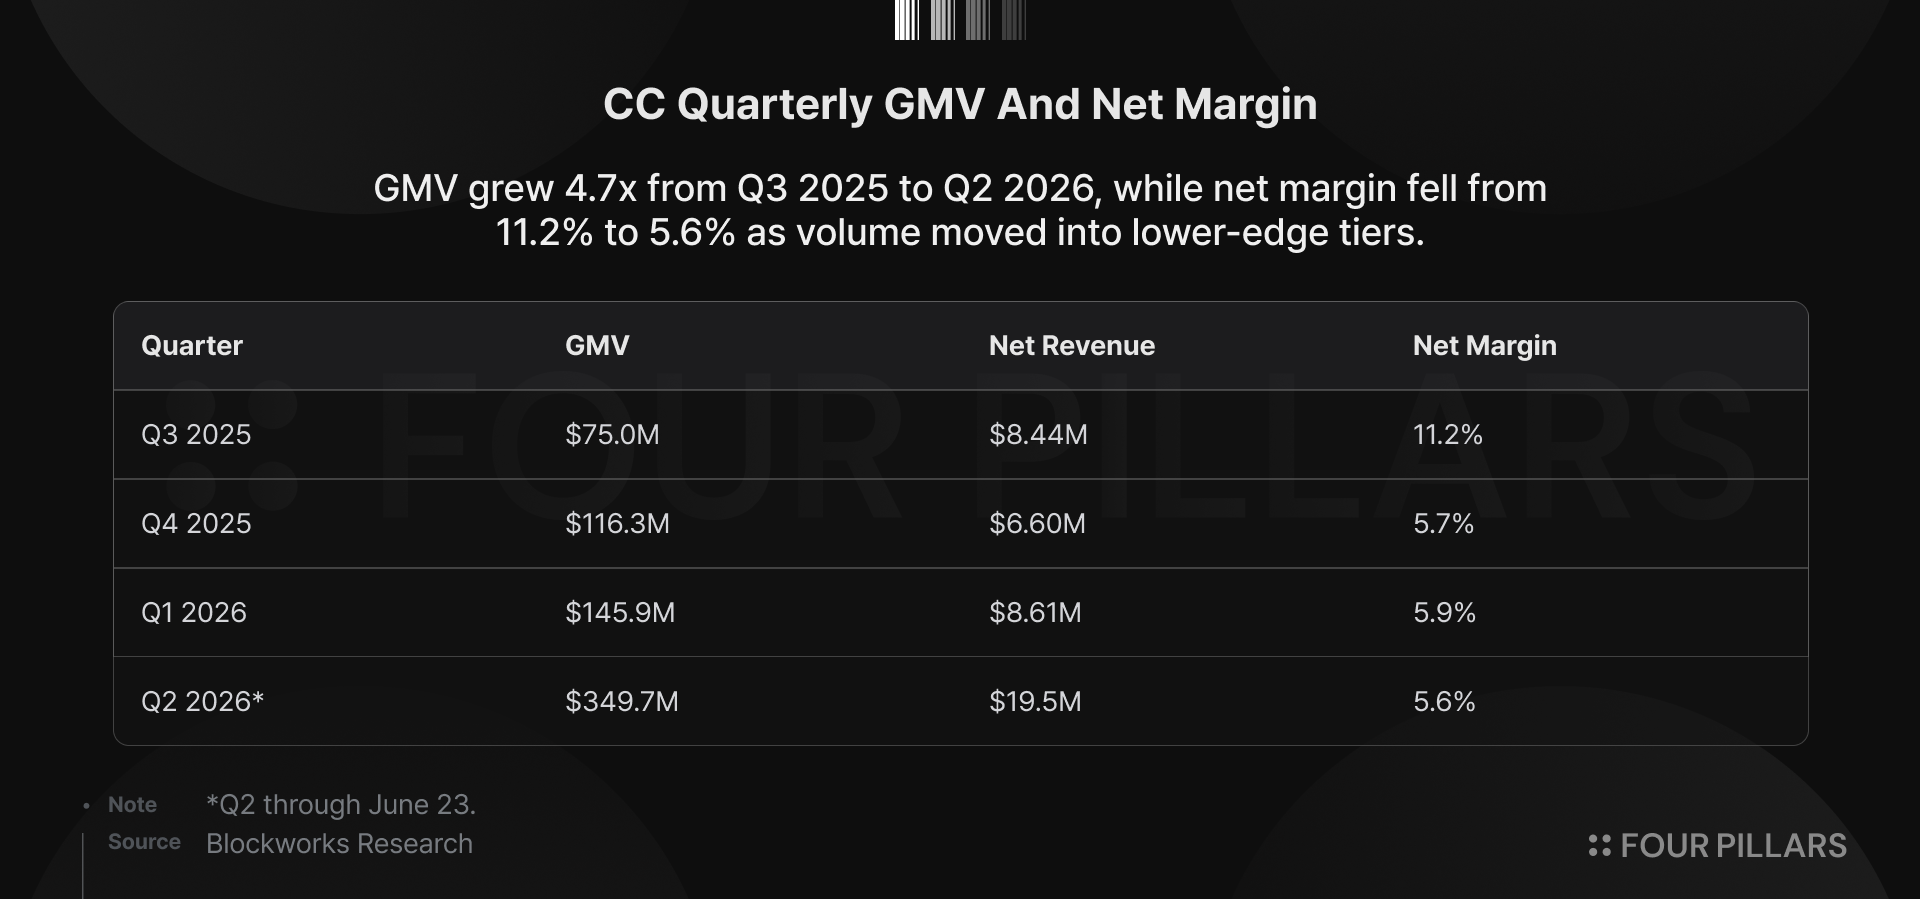
- CC’s net margin fell from 11.2% in Q3 2025 to 5.6% in Q2 2026 while GMV grew 4.7x, as volume migrated toward the $250, $1,000, and $2,500 packs where CC retains less per dollar than in smaller tiers.
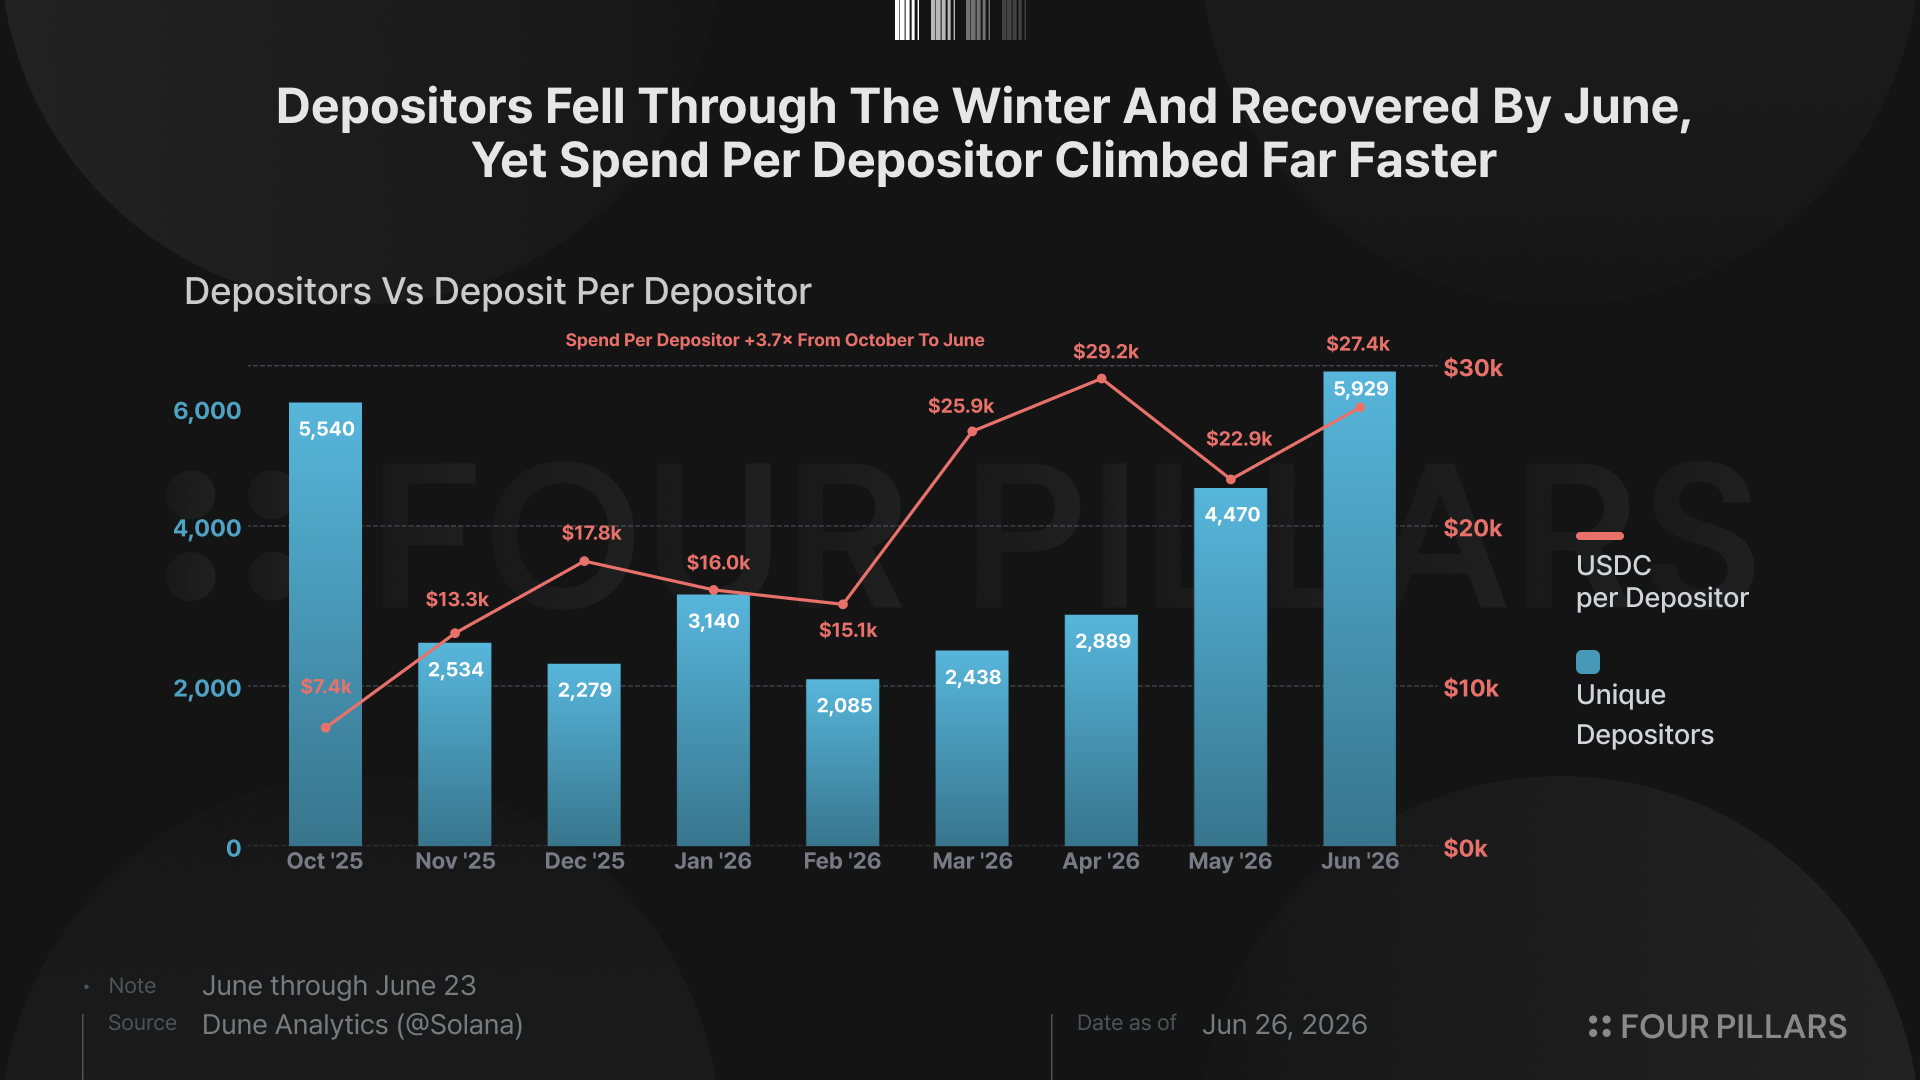
- The $2,500 Mythic tier captured 36.7% of June GMV within thirteen days of launch, while spend per depositor rose sharply from October 2025 to June 2026, showing that growth has been driven by larger tickets and heavier wallet activity, not just broader user growth.
- Physical redemptions consumed 41.6% of May pre-burn net revenue. In observable onchain data, 75 user wallets redeemed cards out of ~6k June depositors, with the top four user redeemers accounting for 47.1% of user burns.
- In our scenario model, CC’s economics turn negative when two of three pressures appear together: inventory replacement cost moves toward market price, redemption rates rise above 9%, or high-tier buyback rates remain near 93%.
- Partner revenue totals $1.83M all-time, with most of it tied to Moonbirds. The broader API and distribution strategy has not yet proven recurring, inventory-light revenue, because publicly verifiable integrations still appear to rely on CC for the card, vault, fulfillment, and buyback layer.
1. Introduction
My first piece on CC (Collector Crypt Has No Collectors) was about classification. CC is trading as an onchain collector marketplace, yet data shows a product driven by repeated gacha loops, instant sellbacks, weak secondary trading, limited token value accrual, and a small base of high-velocity wallets.
This piece starts one layer lower. Since publication, CC added roughly $94M of GMV in ten days, bringing all-time GMV to $728.9M through June 23. Buybacks returned $662.7M to users, net revenue stood at $47.5M, the newly launched $2,500 Mythic tier captured 36.7% of June volume within thirteen days, and Q2 physical redemptions reached $8.9M, more than the first four reported quarters combined. CC can keep printing GMV if users buy larger packs, recycle cards back into the vault, and keep the cash moving through turbo sellback, but each of those channels now presses on what the platform retains.
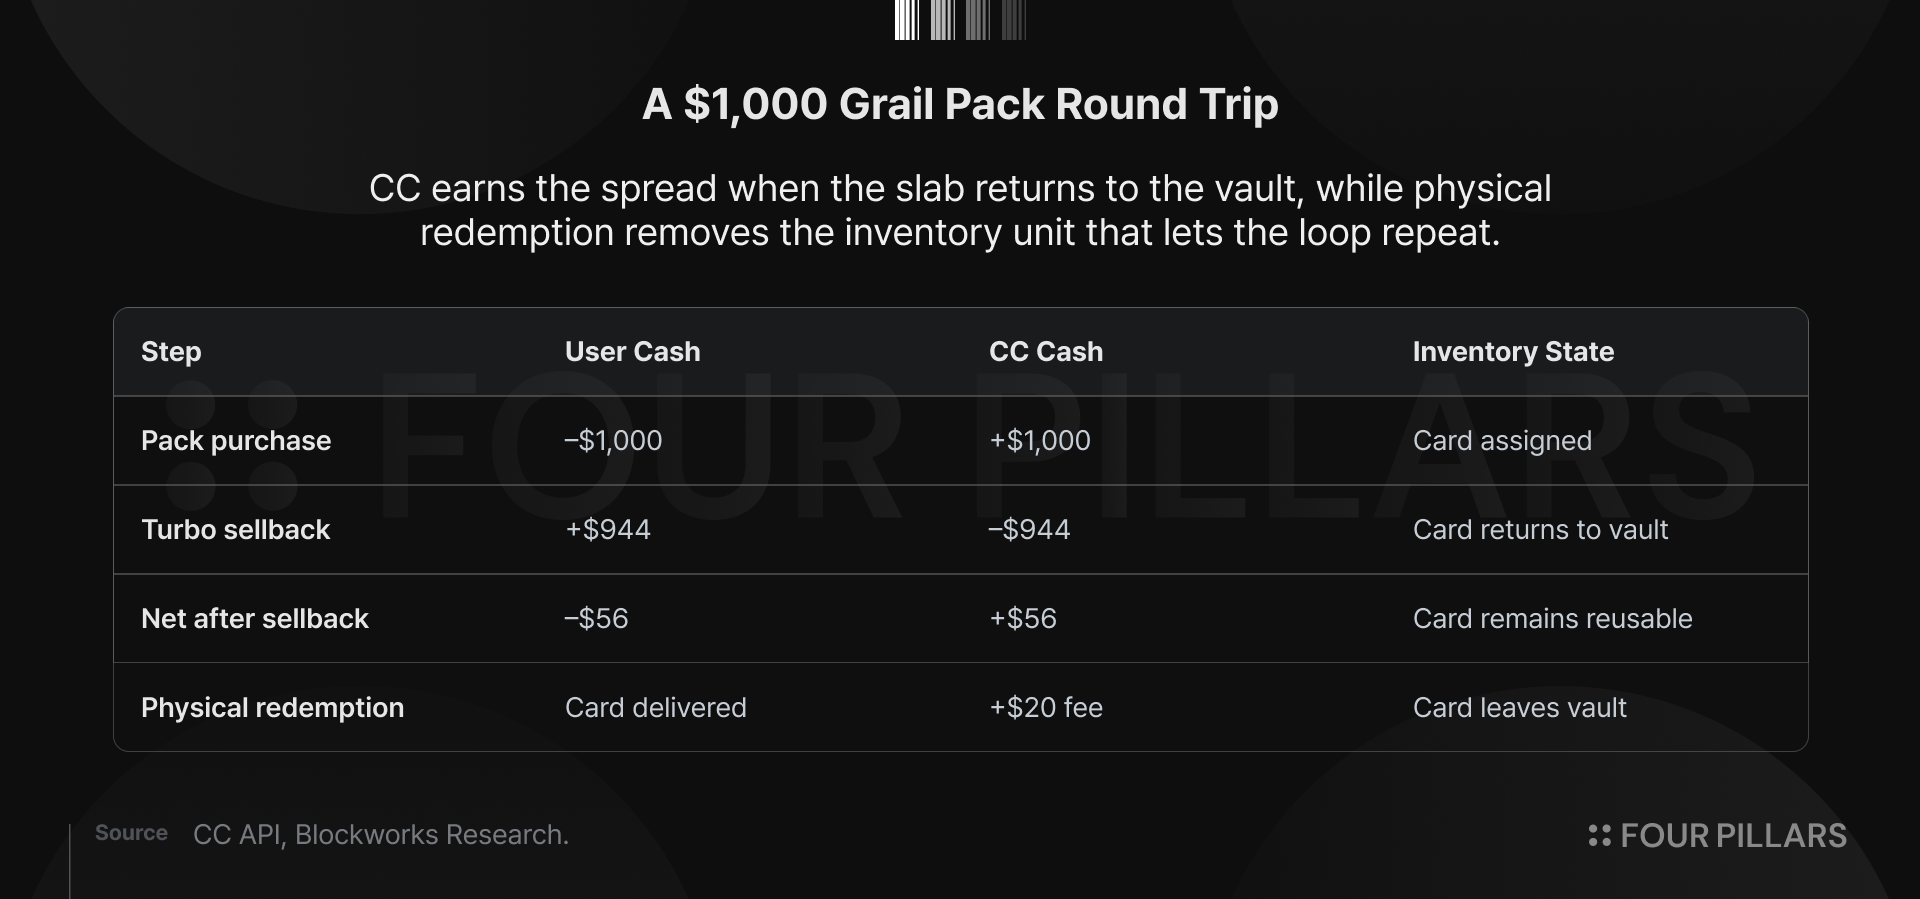
A $1,000 Grail pack shows the cash path. The user pays $1,000, receives a card pool with roughly $1,015 of expected insured value, sells back through turbo at around 93%, and gets $944 returned to the wallet. CC keeps $56 while the slab returns to the vault, where it can be assigned again, sold back again, and used again to generate another spread. The card functions as working capital inside the product loop.
The rest of the piece follows 3 pressure points:
- The denomination ladder lifts GMV while pulling the blended edge lower.
- Redemptions turn reusable slabs into replacement needs.
- Partner integrations broaden distribution, but the verified examples still leave CC responsible for the underlying inventory, fulfillment, and buyback layer.
CC can continue posting larger gross numbers if users keep climbing into bigger packs, but the bottleneck lies in retaining enough of each dollar once the cards have to keep cycling, the cash has to keep moving, and partner distribution still depends on CC’s operating layer.
2. CC’s Net Margin Halved As Volume Migrated Into Larger Packs With Thinner House Edges
CC’s fastest route to higher GMV is a larger pack size. The $25 and $50 packs carry 9% to 11% house edges, the $250 tier sits near 7%, the $1,000 Grail tier sits near 5.6%, and the $2,500 Mythic tier carries 6.4%.
From January through April, the $250 and $1,000 tiers consistently drove three-quarters or more of monthly GMV before Mythic absorbed the next leg of high-ticket activity in June. A few heavy wallets cycling through $1,000 and $2,500 packs can generate more reported activity than thousands of small casual spins, while paying a lower loss rate per dollar.
The platform gets scale, the player gets a slower bleed, and the blended margin moves toward the largest tiers.
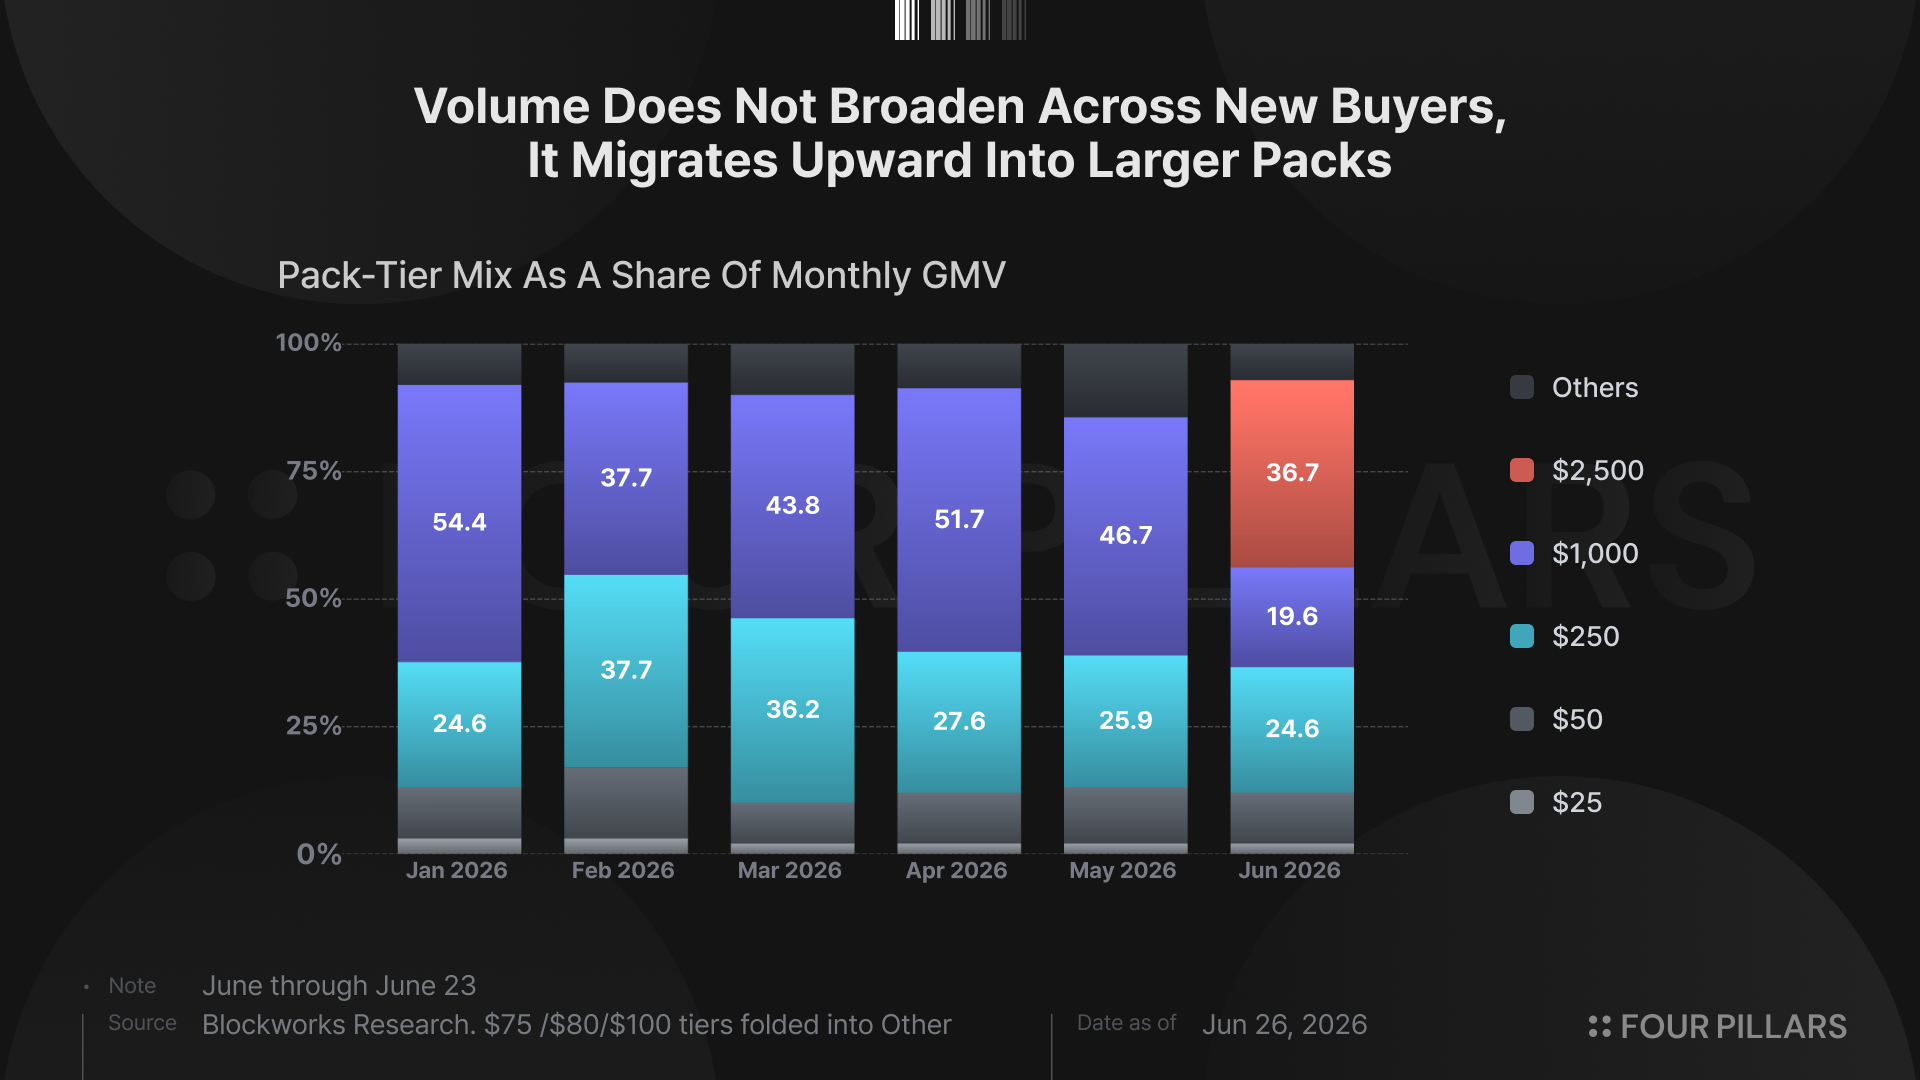
Mythic launched on June 10 and produced $59.3M of GMV in its first thirteen days. The $1,000 tier fell from 46.7% of May GMV to 19.6% in June, while Mythic took 36.7% almost immediately. The change did not require a new collector habit, a deeper secondary market, or a new category of physical demand. It required a bigger ticket for users already willing to recycle capital through randomized packs at scale.
A $5,000 Celestial tier already appears in the CC API with zero stock, giving the platform another rung if it wants to push the same pattern further.
Q3 2025 produced $75.0M of GMV at an 11.2% net margin, Q2 2026 produced $349.7M through June 23 at a 5.6% net margin. GMV increased 4.7x, while net revenue increased 2.3x. CC handled far more activity and kept a smaller share of each dollar.
User data confirms the same migration at wallet level. Depositors fell from 5,540 in October to 2,438 in March and 2,889 in April, while spend per depositor rose to $25,856 and $29,247 in those same two months. June then brought depositor count back to 5,929, but spend per depositor still sat at $26,968, more than 3.6x October’s level. The platform did not simply add more users. Rather, it pushed far more dollars through each active depositor, with the cleanest signal arriving in March and April, when user count was depressed and per-user spend reached the highest levels in the series.
Wallet classification over the latest 90 days makes the same point from the bottom up. Twenty-five wallets doing more than 1,000 transactions per day and 139 wallets doing 100 to 999 transactions per day produced 76.9% of total volume. The top wallet alone deposited $34.6M and made 241,120 transactions over 76 days. That said, CC’s yolo pack feature lets users batch up to 100 pack opens in a single session, with each pack generating a separate on-chain transaction, so a single user action can produce dozens of recorded transactions.
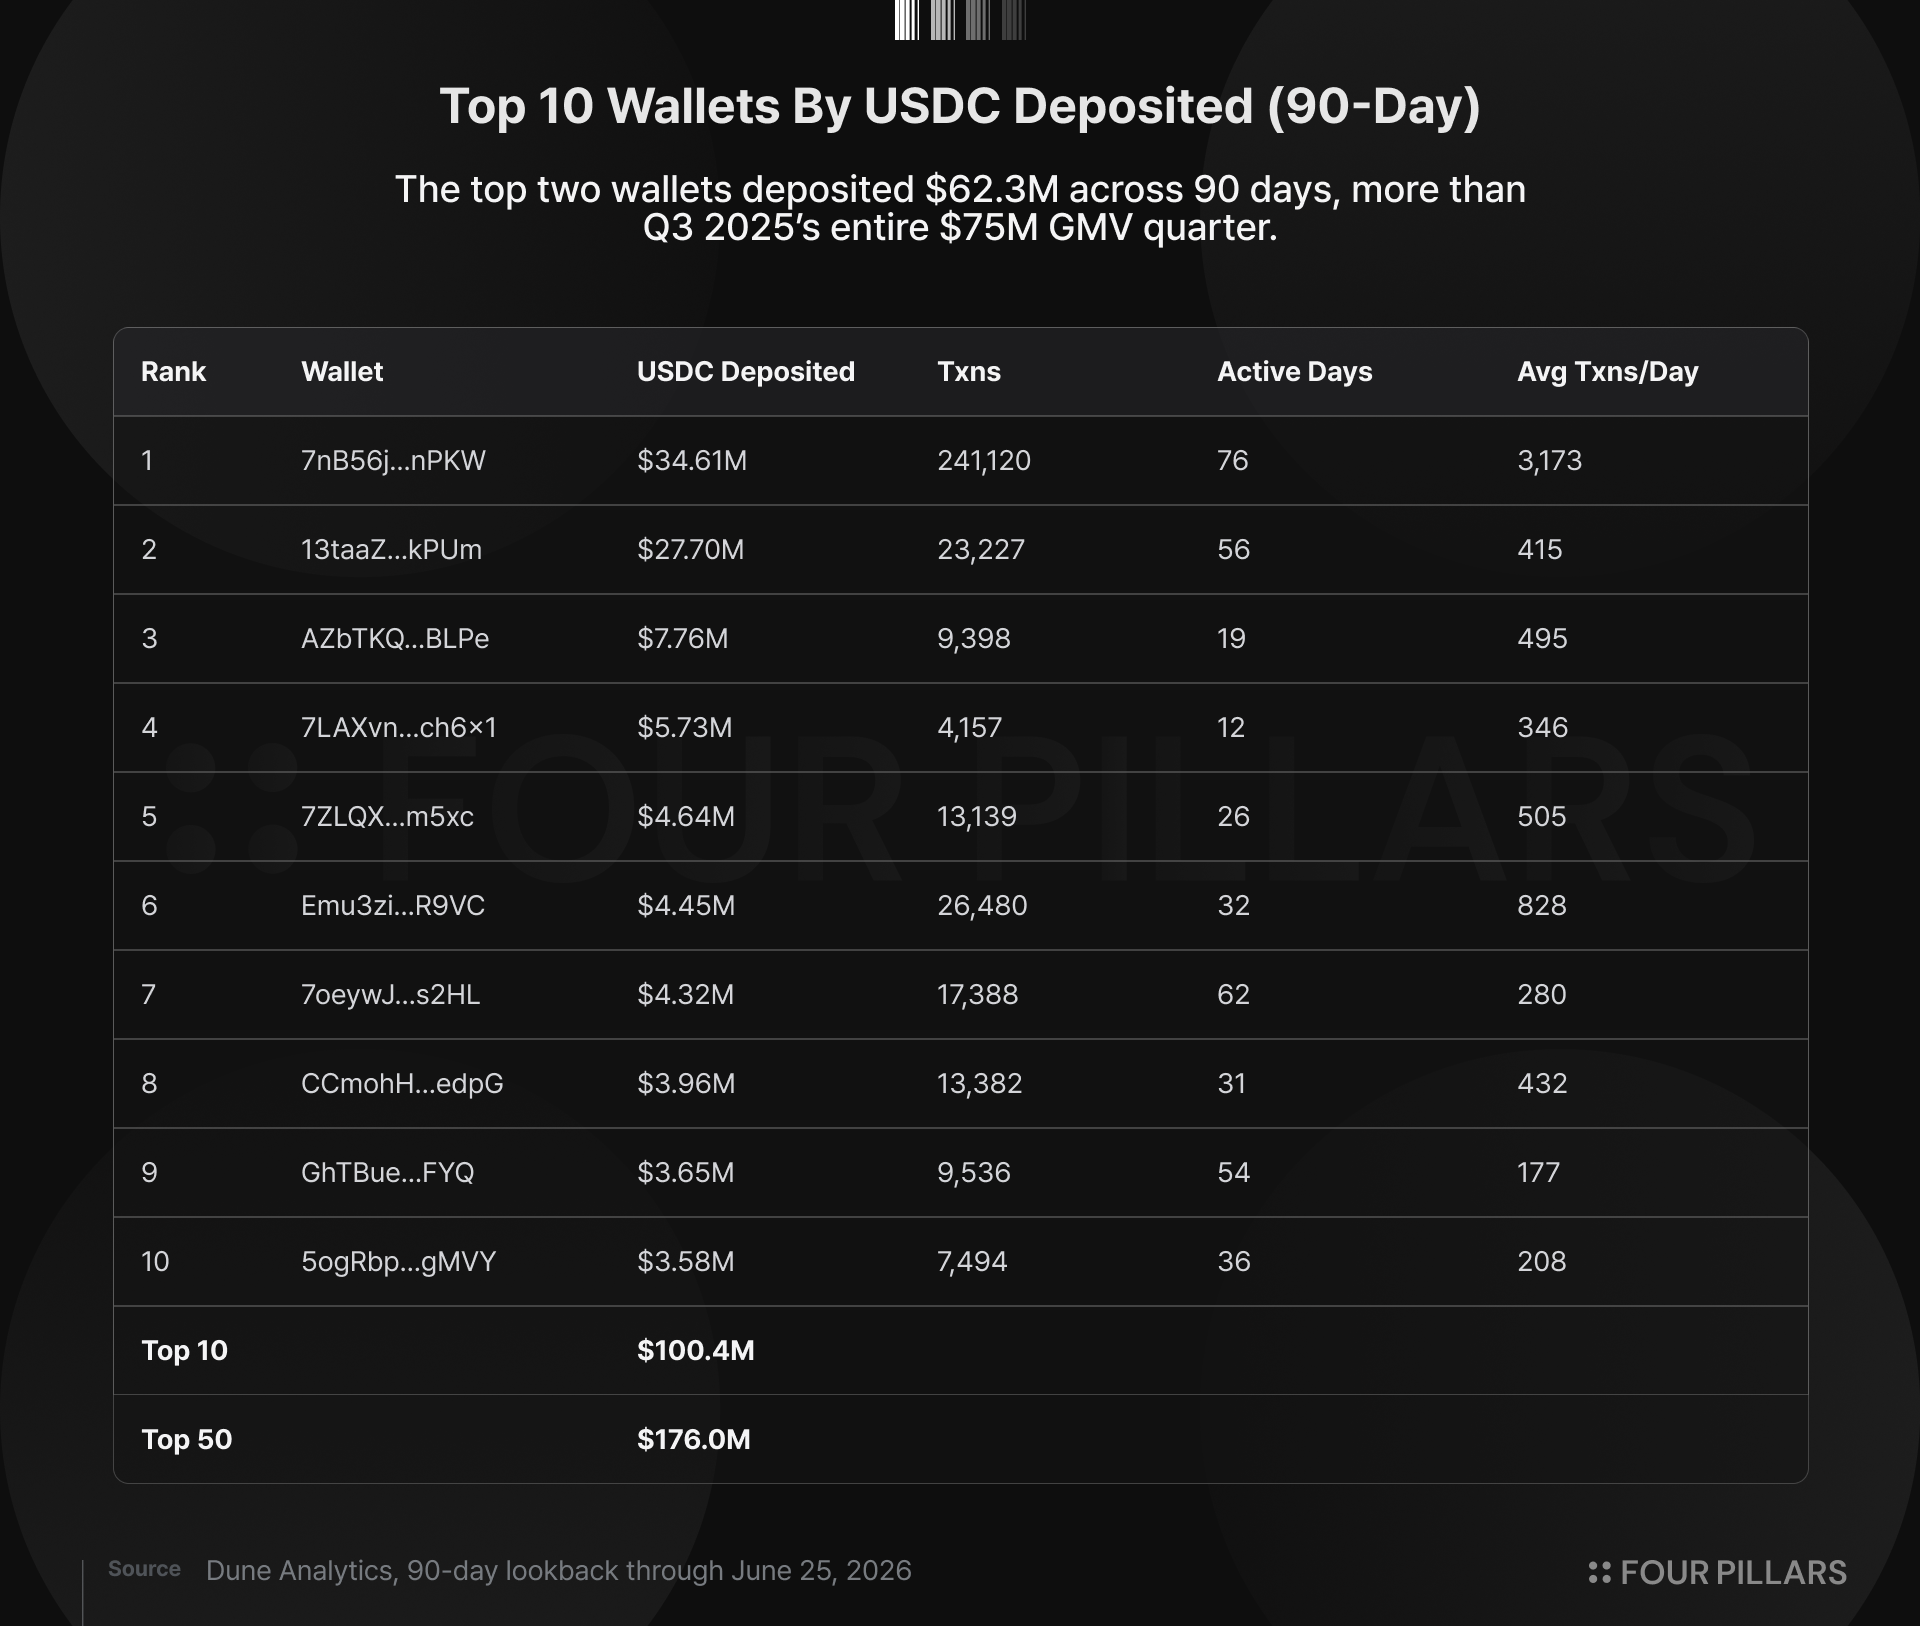
Of the top 10 depositors by USDC volume, seven had zero Metaplex Core interactions with the CC collection in June, meaning no burns, no transfers, no on-chain card activity beyond pack opens and buybacks. Three wallets showed minimal Core activity: GhTBue with 6 transactions, AZbTKQ with 5, and 7LAXvn with 1, a combined 12 interactions against 365,000+ pack transactions.
These users are useful for reported volume, but less helpful for retained margin. They cycle capital through packs and buybacks without redeeming cards, trading on the secondary market, or building a collection. Each new rung gives them more capacity to push capital through the lowest-retained part of the core structure.
The wallets that do redeem are a different population entirely. Only 75 user wallets burned cards in June out of over 6,000 depositors, and the top four user redeemers accounted for nearly half of user burns. CC’s volume source and its inventory drain are driven by separate groups with opposite behaviors. One group generates throughput at thinner margins, while the other creates the inventory replacement need that makes the loop more expensive to sustain.
3. Physical Redemptions Consumed 42% Of May Pre-Burn Net Revenue, With 75 Wallets Driving The Burn Activity
Physical redemptions reached $20.0M of insured value all-time through June 23. Q2 alone contributed $8.9M, more than the first four reported quarters combined. CC also collected $929K of burn revenue from redemption fees, which creates a clean optical line in the data.
The cash trade is less clean. A redeemed card leaves the vault, stops supporting future pack cycles, and forces the platform back into external sourcing.
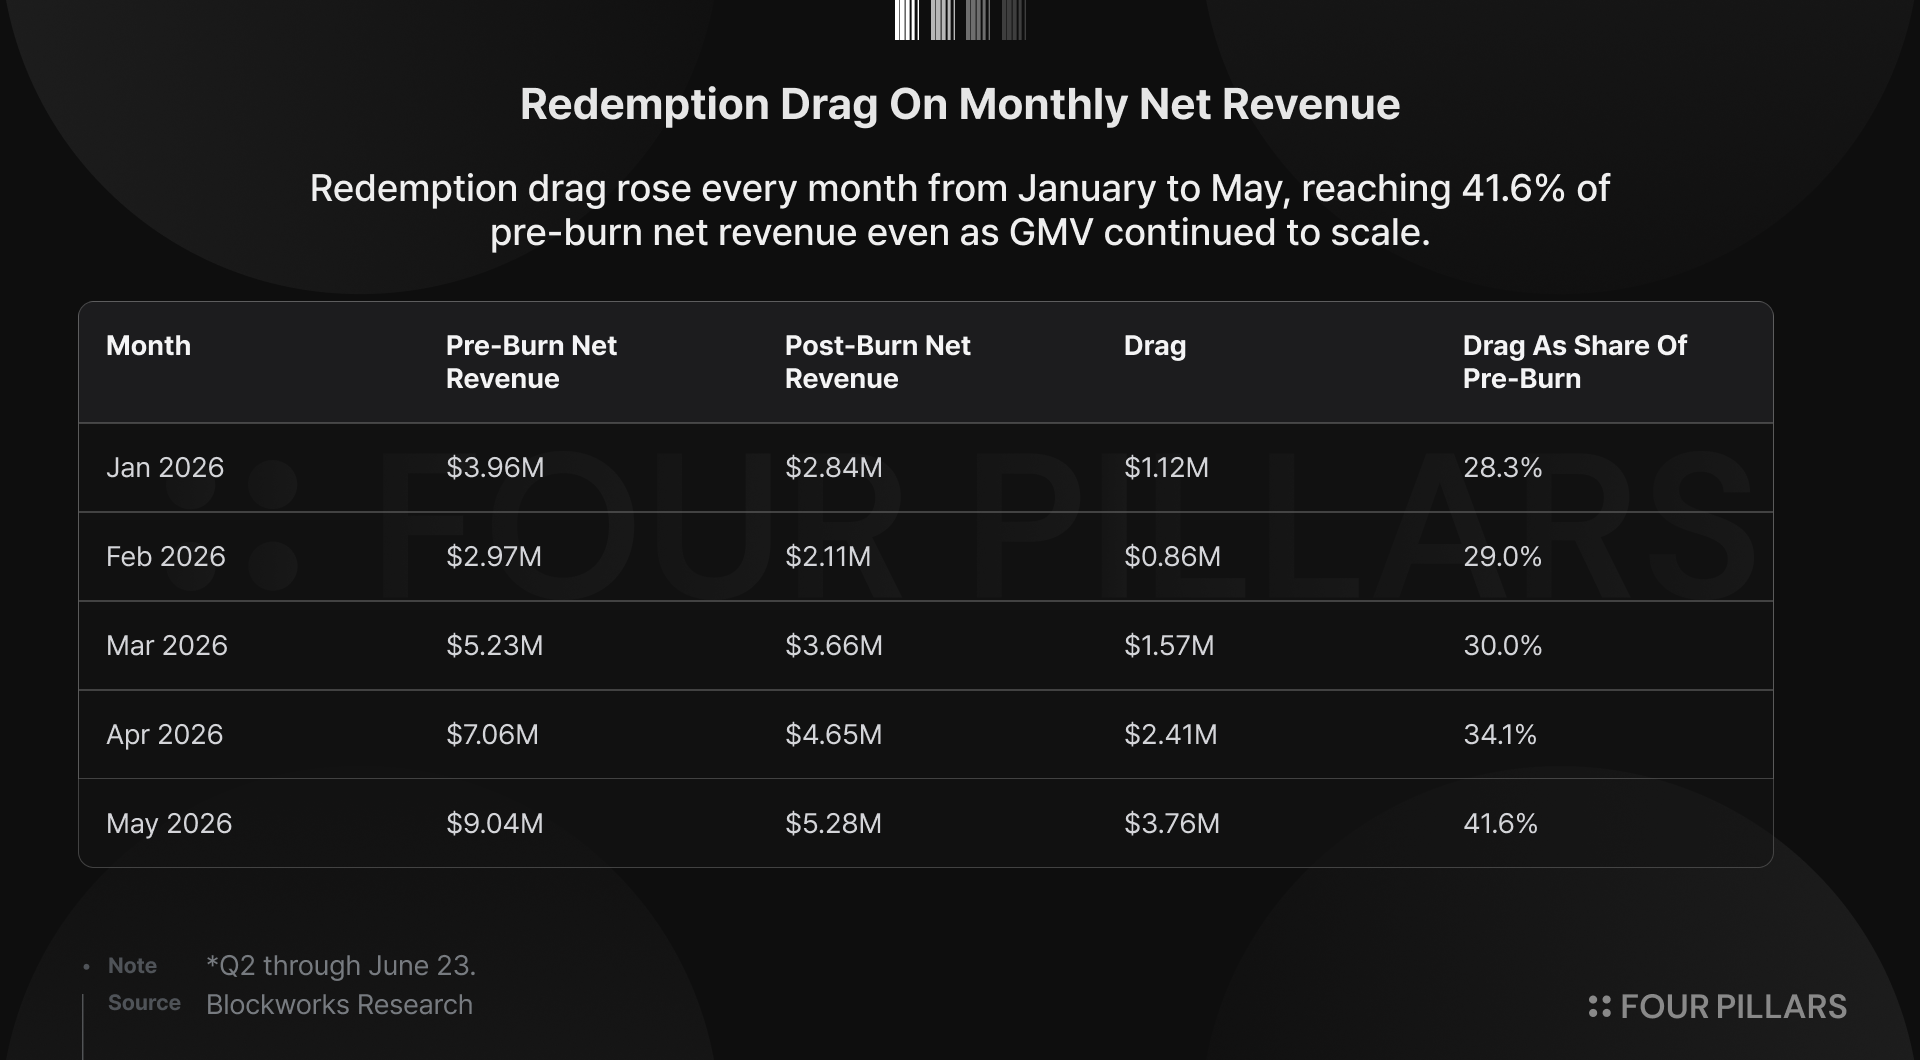
May showed how quickly redemptions can absorb the spread. CC generated $9.04M of pre-burn net revenue and kept $5.28M after redemption costs, leaving $3.76M of drag. This happened during a period of rising GMV, so the redemption burden did not wait for the platform to mature into a broader collector base. It arrived inside the same high-velocity loop, where a small number of wallets can remove high-value inventory fast enough to matter.
The wallet-level burn data narrows the read. From June 11 to June 25, Dune recorded 742 total NFT burns for the CC card collection. CC-controlled wallets accounted for 311 burns, while 75 user wallets accounted for 431. The top four user redeemers accounted for 203 burns, equal to 47.1% of user burns. Eight bulk redeemers with 10 or more burns accounted for 325 burns, equal to 75.4% of user burns. Only 30 wallets redeemed exactly one card during the window.
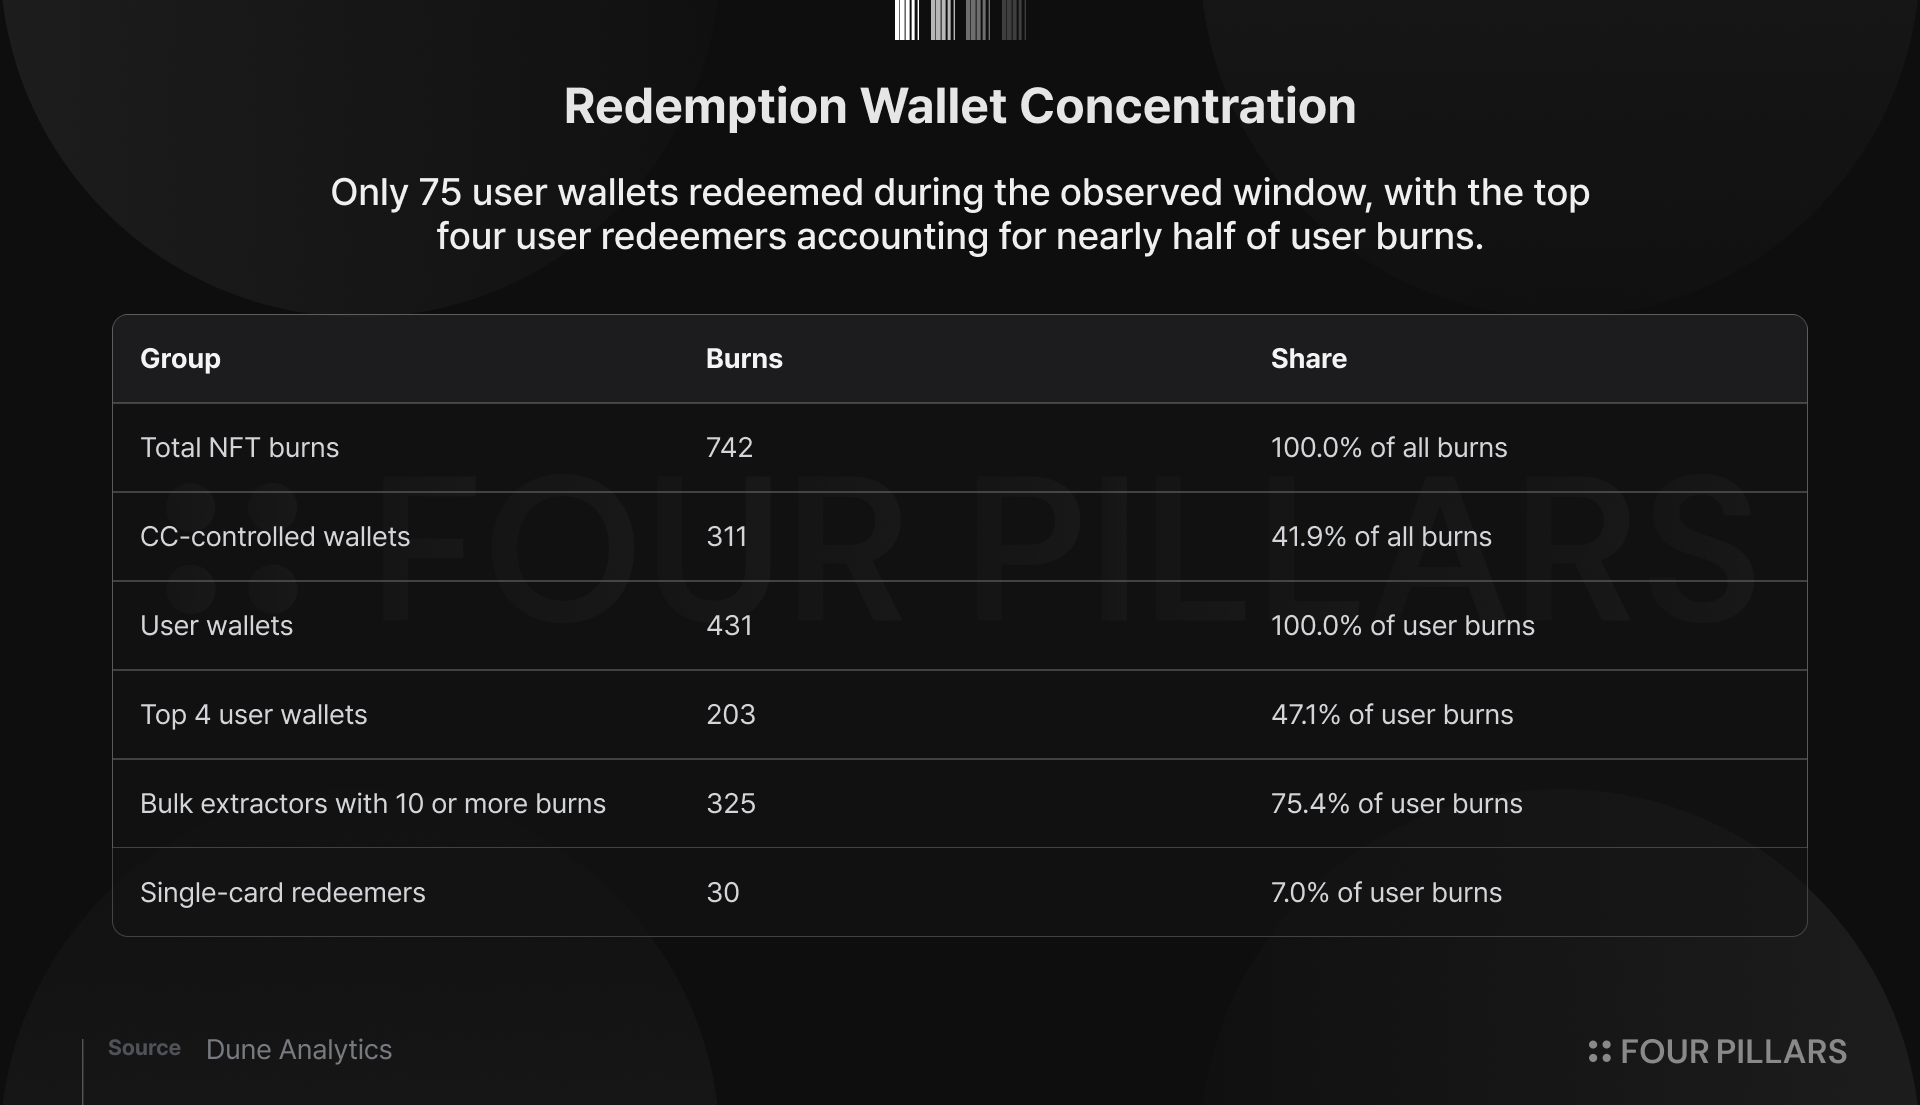
Against June depositors, redemption participation was 1.22%. Single-card redeemers represented 0.49% of depositors. The visible redemption base is small, concentrated, and dominated by bulk activity. That mix is adverse for CC because the the visible redemption activity is not yet broadly distributed across the user base in the way a deep collector marketplace would imply. They are removing inventory in size while most depositors continue to recycle capital through buybacks.
Redemption growth therefore tightens the same operating constraint. Sellbacks require attractive rates to keep user capital moving, while redemptions remove the graded slabs that make future pack cycles possible. When both grow together, CC can still increase GMV, but more of that gross activity comes with lower retained margin and higher replacement demand on the vault.
4. Grading Lanes Tightened, GameStop Entered, And Market-Price Inventory Turns The Model Negative
As physical redemptions grow, the relevant cost is not the stated value of the card that leaves the vault, but the cost of replacing it with equivalent graded inventory. CC’s loop works best when graded slabs remain inside the vault, are assigned into packs repeatedly, and return through buybacks. Once a user redeems a physical card, that slab exits the cycle, forcing CC either to buy an equivalent graded card in the market or to acquire raw inventory and send it through grading again.
CC CEO Tuomas Holmberg has described acquiring inventory at 85% to 90% of market price through dealer relationships, with an automated eBay bidding system winning approximately 100 to 150 cards per day. That claim can be true and still leave the model fragile. Buying below market works best when grading capacity is loose and competitors are not pressuring the same channel.
GameStop is competing for the same inventory with a better balance sheet and better physical reach. Power Packs launched on April 15 2026 with a PSA partnership, the same $25 to $2,500 gacha range, and 90% fair-market-value buyback minus a 6% selling fee, netting users roughly 84.6%. GameStop has $8.4B in cash and marketable securities, more than 1,360 retail locations serving as PSA grading intake points, over 1M cards graded in less than seven months, and Nat Turner, CEO of PSA parent Collectors Holdings, on its board. Its collectibles segment reached $348.9M of Q1 FY2026 revenue and became its largest segment.
The grading market has also become less forgiving. PSA Value Bulk grading at $24.99 per card was paused on June 2 amid a reported backlog, leaving Regular at $79.99 per card as the cheapest available public tier. Higher grading costs and longer turnaround times is important because a gacha platform does not need random raw inventory. It needs graded, priced, custody-ready slabs that can be loaded into machines and repurchased at controlled rates. Every redemption increases the need for that inventory at the moment cheap throughput has become harder to access.
The sensitivity model shows why acquisition cost cannot remain a footnote. At a 93% buyback rate and a 3% redemption rate, CC’s net margin remains positive even if inventory cost moves from 85% to 100% of insured value. At a 9% redemption rate, the same market-cost assumption pushes net margin below zero. At a 15% redemption rate, the model is negative across 85%, 100%, and 120% inventory-cost assumptions.
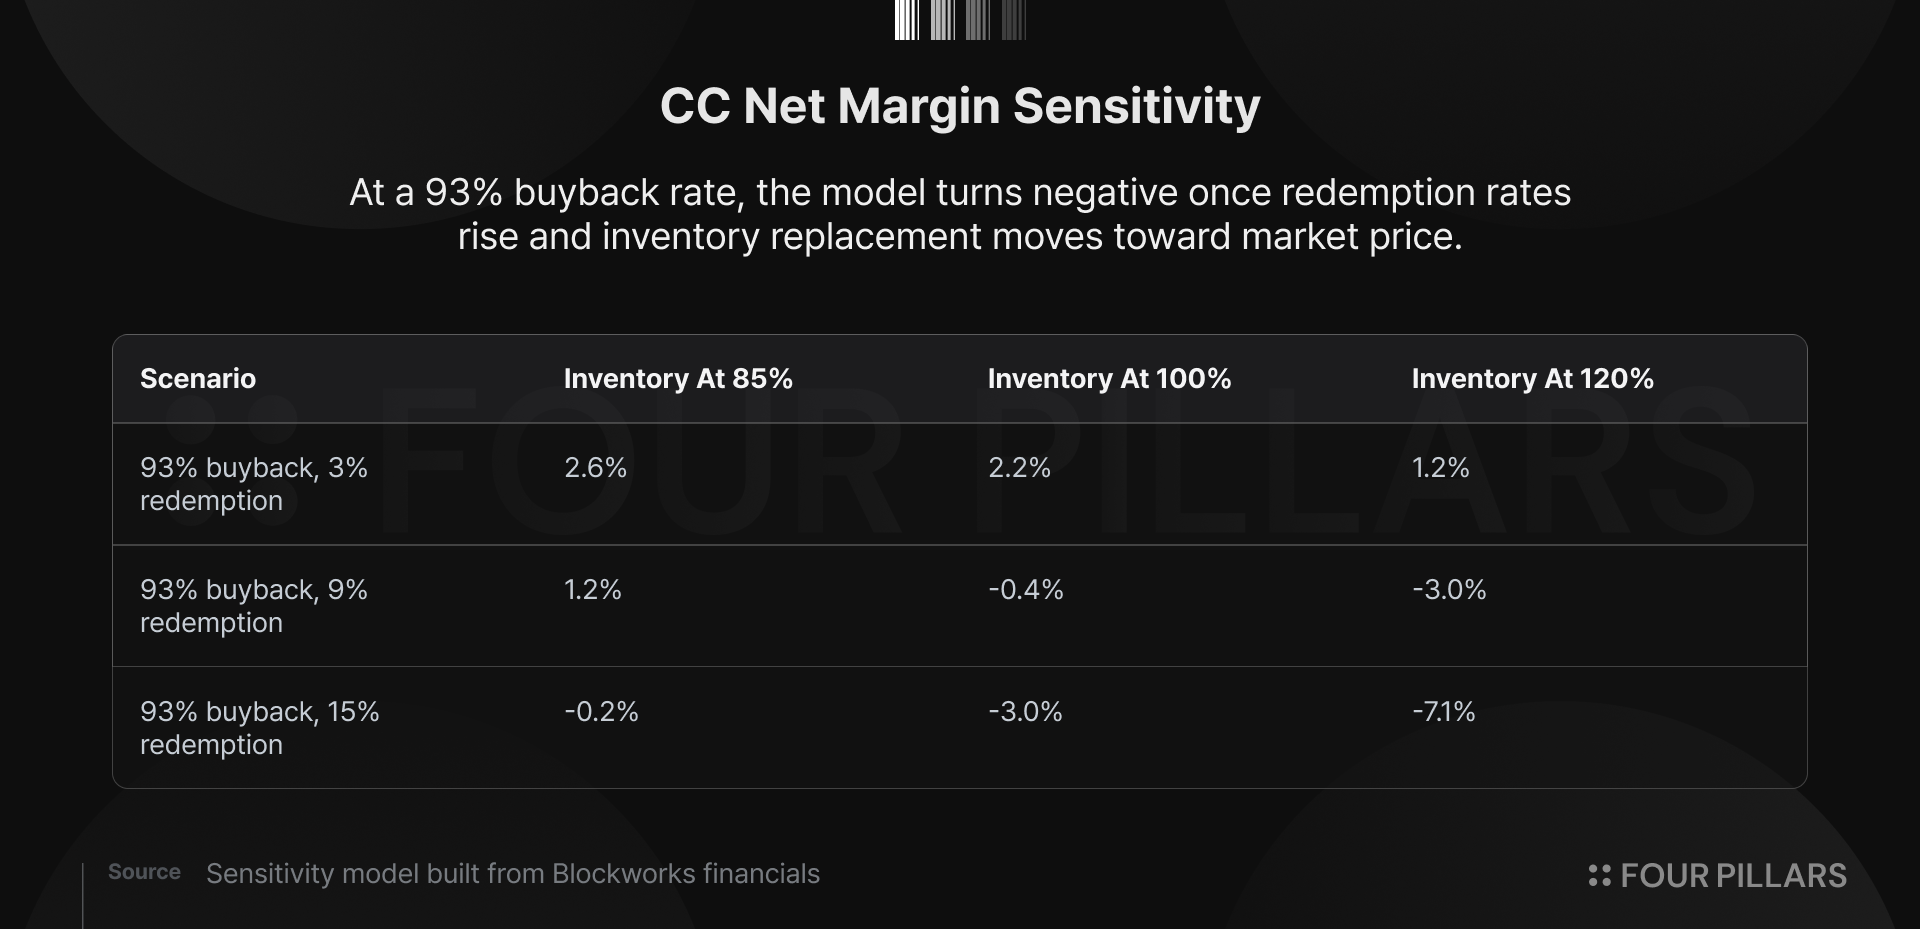
This model does not require heroic stress assumptions. A 93% buyback rate already exists in high-tier packs. Redemption pressure has already climbed enough to consume 41.6% of pre-burn net revenue in May. Market-cost inventory is plausible when supply is constrained and a larger player enters with cash, retail stores, PSA connectivity, and a competing gacha format. CC can absorb one adverse input. Two push the business toward zero margin; three turn scale into a larger version of the same spread compression.
5. The B2B API Strategy Still Has To Prove Repeatability
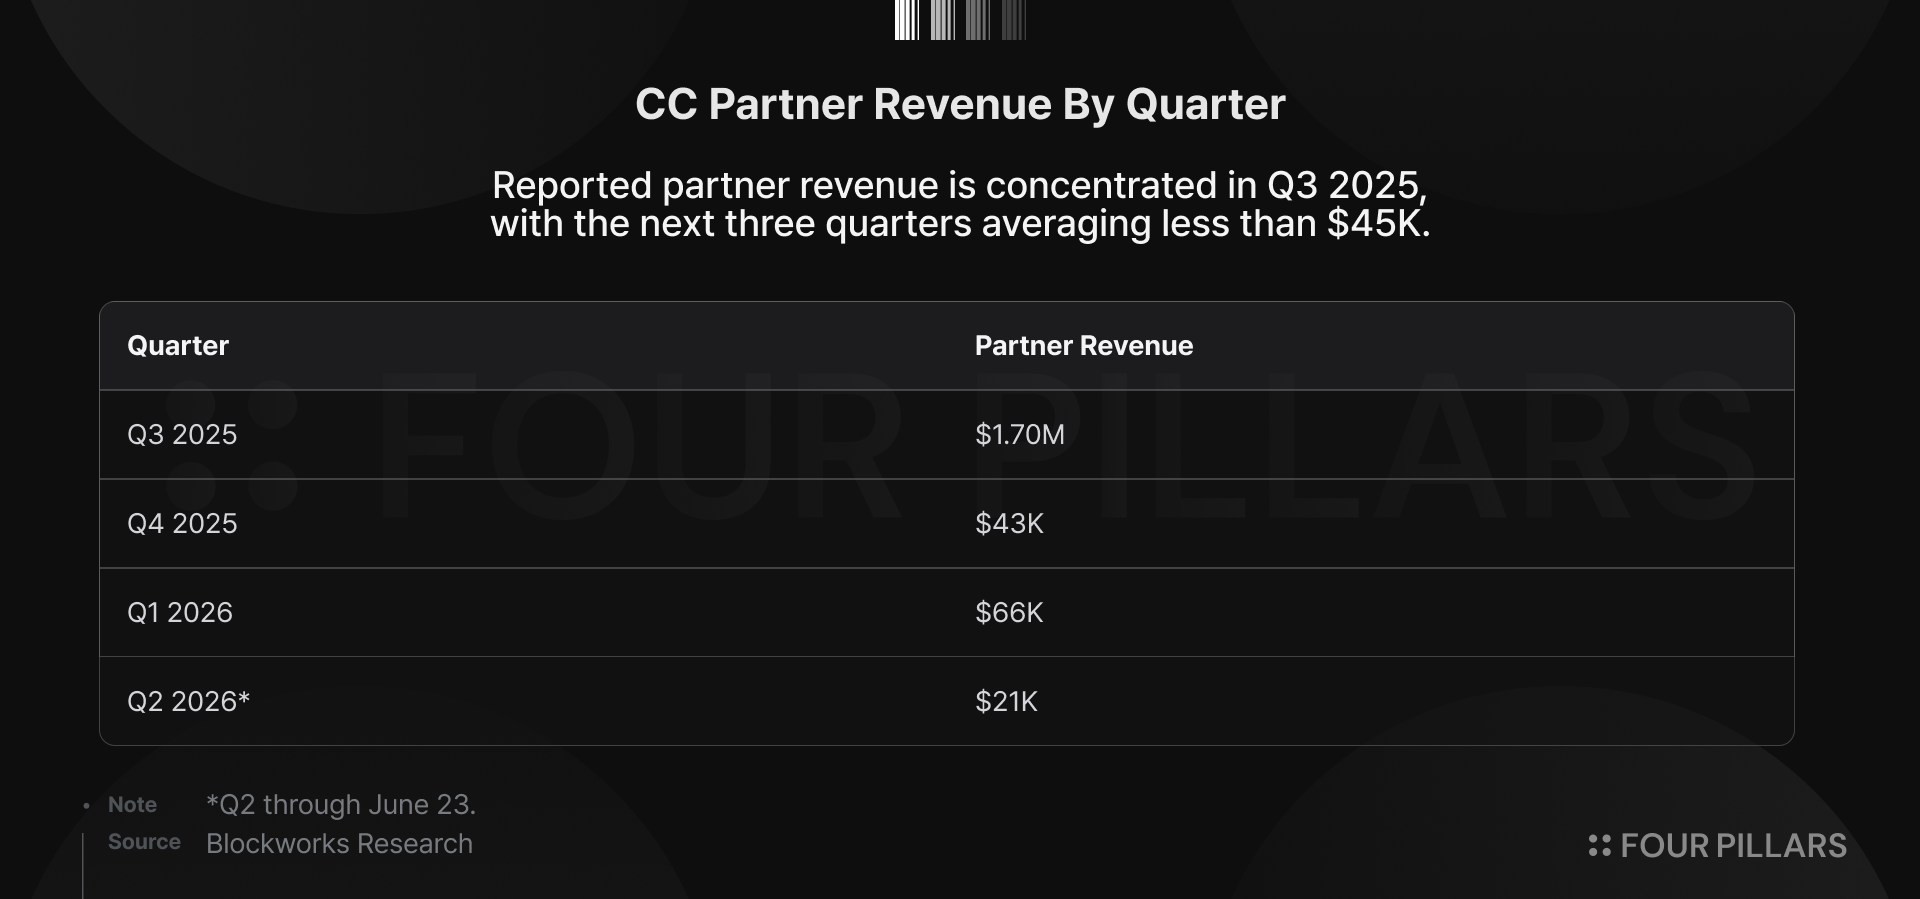
CC’s partner revenue line has one material quarter. Through June 23, partner revenue totaled $1.83M all-time, with $1.70M recorded in Q3 2025 and only $43K, $66K, and $21K in the next three quarters. The Q3 amount arrived on September 11 and September 12, representing 93% of all-time partner revenue. Blockworks describes Partnership Revenue as mainly tied to Moonbirds, covering the entire mint revenue, while Magic Eden revenue is included in Gachapon Machine revenue instead. The financial record shows a concentrated primary-drop event, followed by three quarters where the line barely registers.
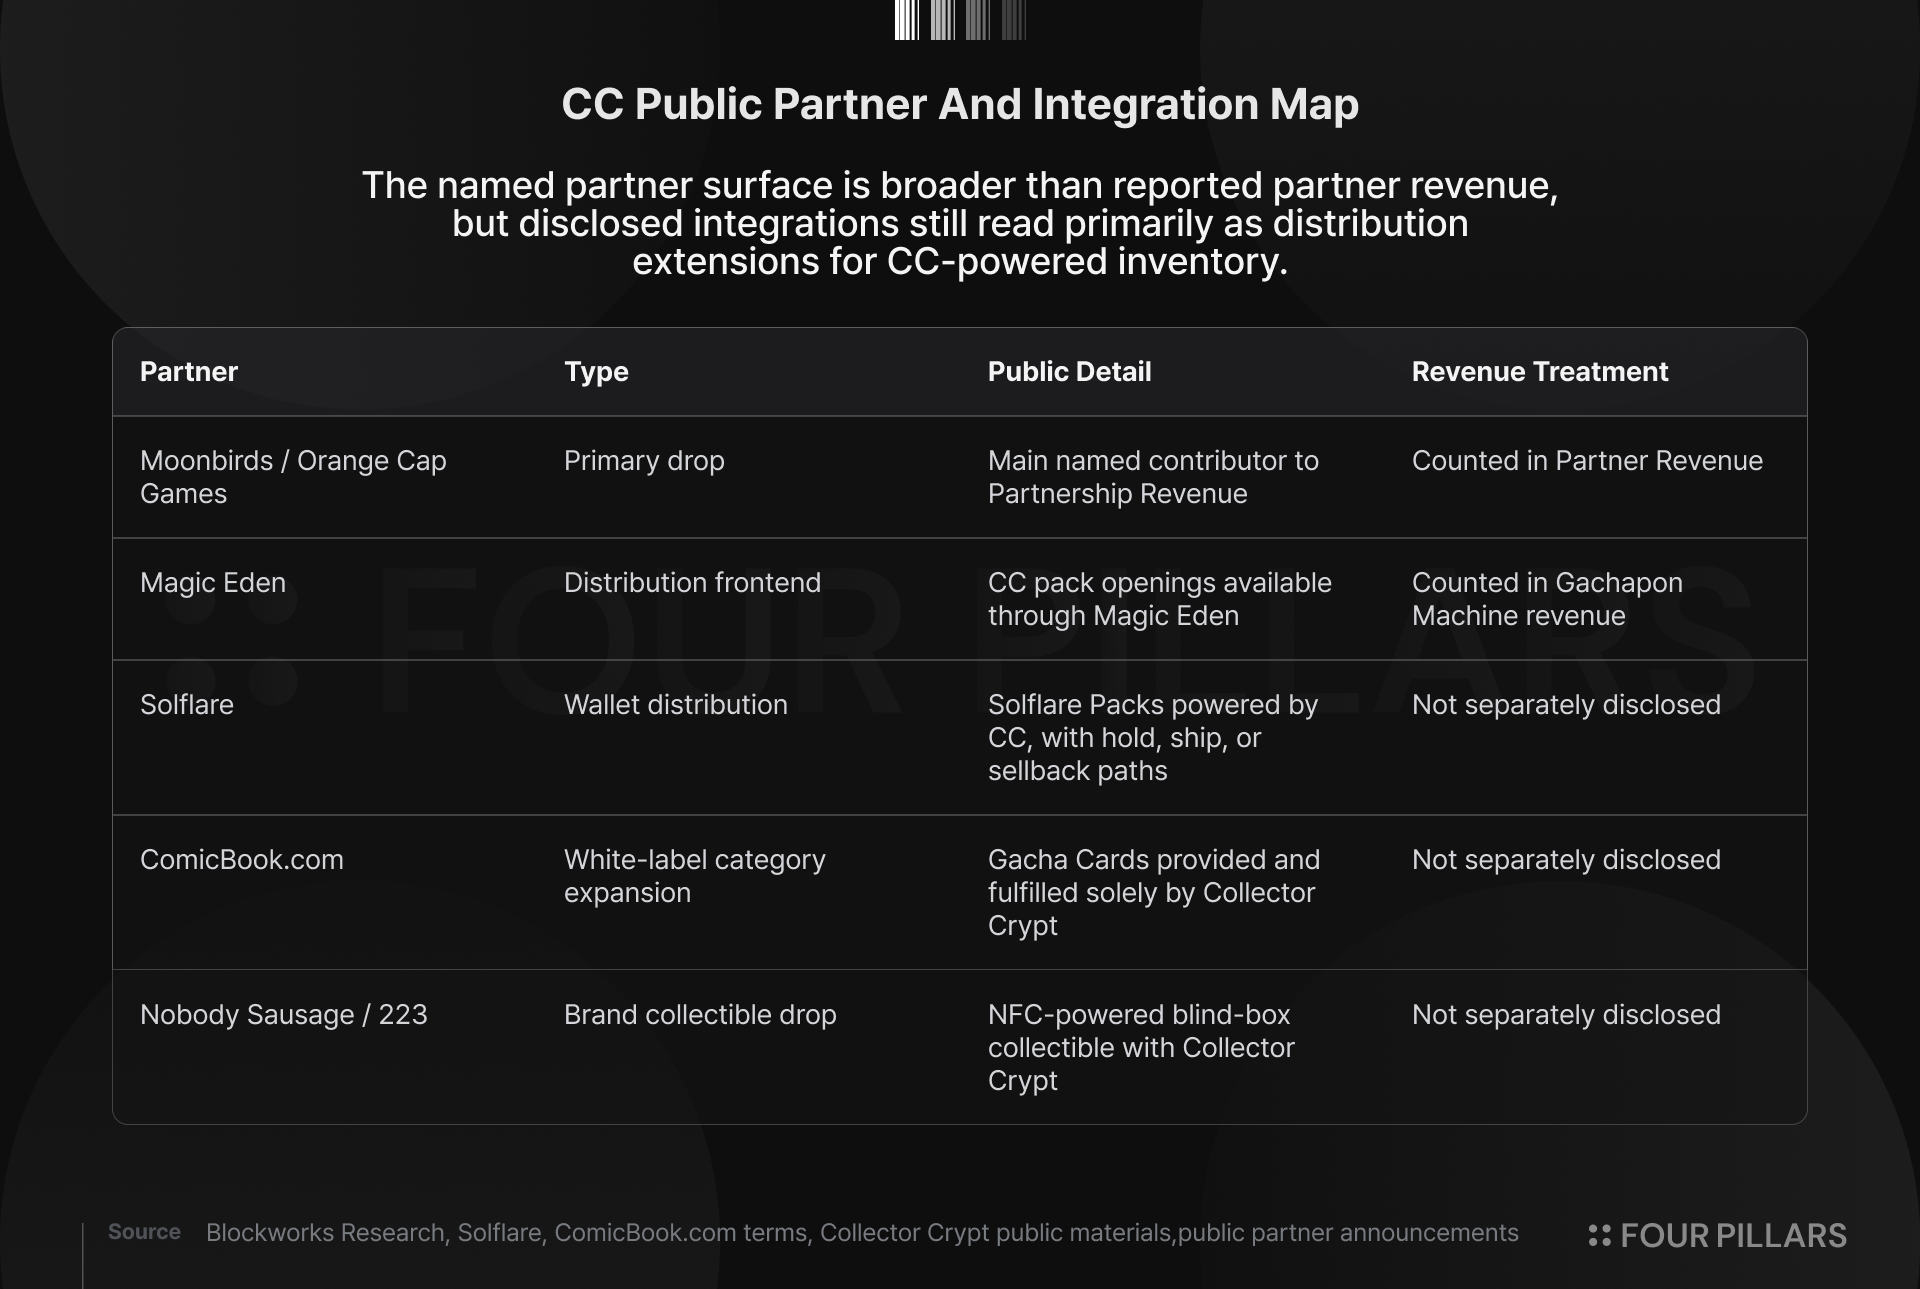
The named partner surface is broader than the reported revenue line, but most disclosed integrations read as distribution instead of independent inventory formation. Magic Eden, Solflare, ComicBook.com, and Nobody Sausage expand where users can encounter CC-powered packs or collectibles. They do not yet show a recurring partner revenue base, partner-funded inventory, or partner-level replacement economics.
Scale therefore carries the same input constraint as the direct product. CC-powered distribution still needs graded cards, dealer relationships, grading throughput, buyback pricing, vault custody, fulfillment, and end-market demand for physical slabs. CC already sources in a market where inventory is hard to obtain, PSA bulk capacity has tightened, and GameStop has entered with cash, stores, PSA connectivity, and a competing gacha format. Adding external surfaces may widen the funnel, but the public integrations we can verify still route the collectible, custody, fulfillment, and buyback burden back through CC before the company has shown stable replacement cost in its own operating layer.
B2B is therefore a correlated extension of the core exposure until proven otherwise. If graded-card demand softens, direct gacha activity and partner-driven activity likely weaken through the same end market. If graded-card demand strengthens, CC faces higher replacement costs across both direct and partner channels. If buyback rates tighten across the category, every CC-powered surface has to manage the same trade between user activity and retained spread. API distribution may make the machine larger, but it has yet to prove a way around the machine’s dependence on cheap, reusable, high-grade inventory.
6. Looking Forward
None of this is an argument against Pokemon cards. I believe the collector economy for graded cards is durable and expanding, with nostalgia-driven buyers entering their peak earning years, card shows pulling parents and children into the hobby together and seeding the next generation of collectors, and eBay alone clearing well over $10 billion in collectibles annually with Pokemon as a dominant category. The rip & ship format has earned huge popularity in late 2024.
CC found a working consumer product inside that market, but the concern is how CC has grown so far. The current lever is to add larger packs, offer high buyback rates, and let high-velocity wallets cycle more capital through the machine. That can inflate GMV quickly, but it does not prove collector-marketplace depth. The data shows volume moving into lower-retained tiers, redemptions turning reusable inventory into replacement needs, and partner distribution still relying on CC’s own inventory and buyback layer.
From here, CC needs to prove three things: 1) It needs broader collector participation, 2) deeper secondary trading, and 3) on-chain ownership that improves how scarce cards are discovered and transacted. It also needs to show that incremental GMV can arrive without continued take-rate compression or rising inventory drag, and that B2B can become a recurring, inventory-light revenue channel instead of another distribution surface for the same gacha machine.
The next proof point is whether larger volume can come with better unit economics, deeper collector behavior, and a B2B revenue line that proves it can scale.
The author of this report may have personal holdings or financial interests in assets or tokens discussed herein. However, the author affirms that no transactions have conducted using material non-public information obtained in the course of research or drafting. This report is intended solely for general information purposes and does not constitute legal, business, investment, or tax advice. It should not be used as a basis for making any investment decisions or as guidance for accounting, legal, or tax matters. Any references to specific assets or securities are made for informational purposes only and should not be construed as an offer, solicitation, or recommendation to invest. The opinions expressed herein are those of the author and may not reflect the views of any affiliated institutions, organizations, or individuals. The opinions and analyses expressed herein are subject to change without prior notice. In addition, beyond the individual disclosures included in each report, Four Pillars, may hold existing or prospective investments in some of the assets or protocols discussed herein. Furthermore, FP Validated, a division of Four Pillars, may already be operating as a node in certain networks or protocols discussed herein or may do so in the future. Please see below links in the footer for FP Validated's participating network disclosures and for broader disclosure details.


