Table of Contents

1. Something Different About This Bear Market
Stablecoin supply is one of the first indicators to check when crypto markets come under pressure. It gives a sense of how much capital is waiting on exchanges and onchain to buy crypto. That pool of capital is now shrinking fast.
Total stablecoin supply stood at about $286.3B on November 18, roughly $26.5B below its May 17 peak of $312.9B. A decline in total supply means that redemptions for dollars through issuers have outpaced new issuance.
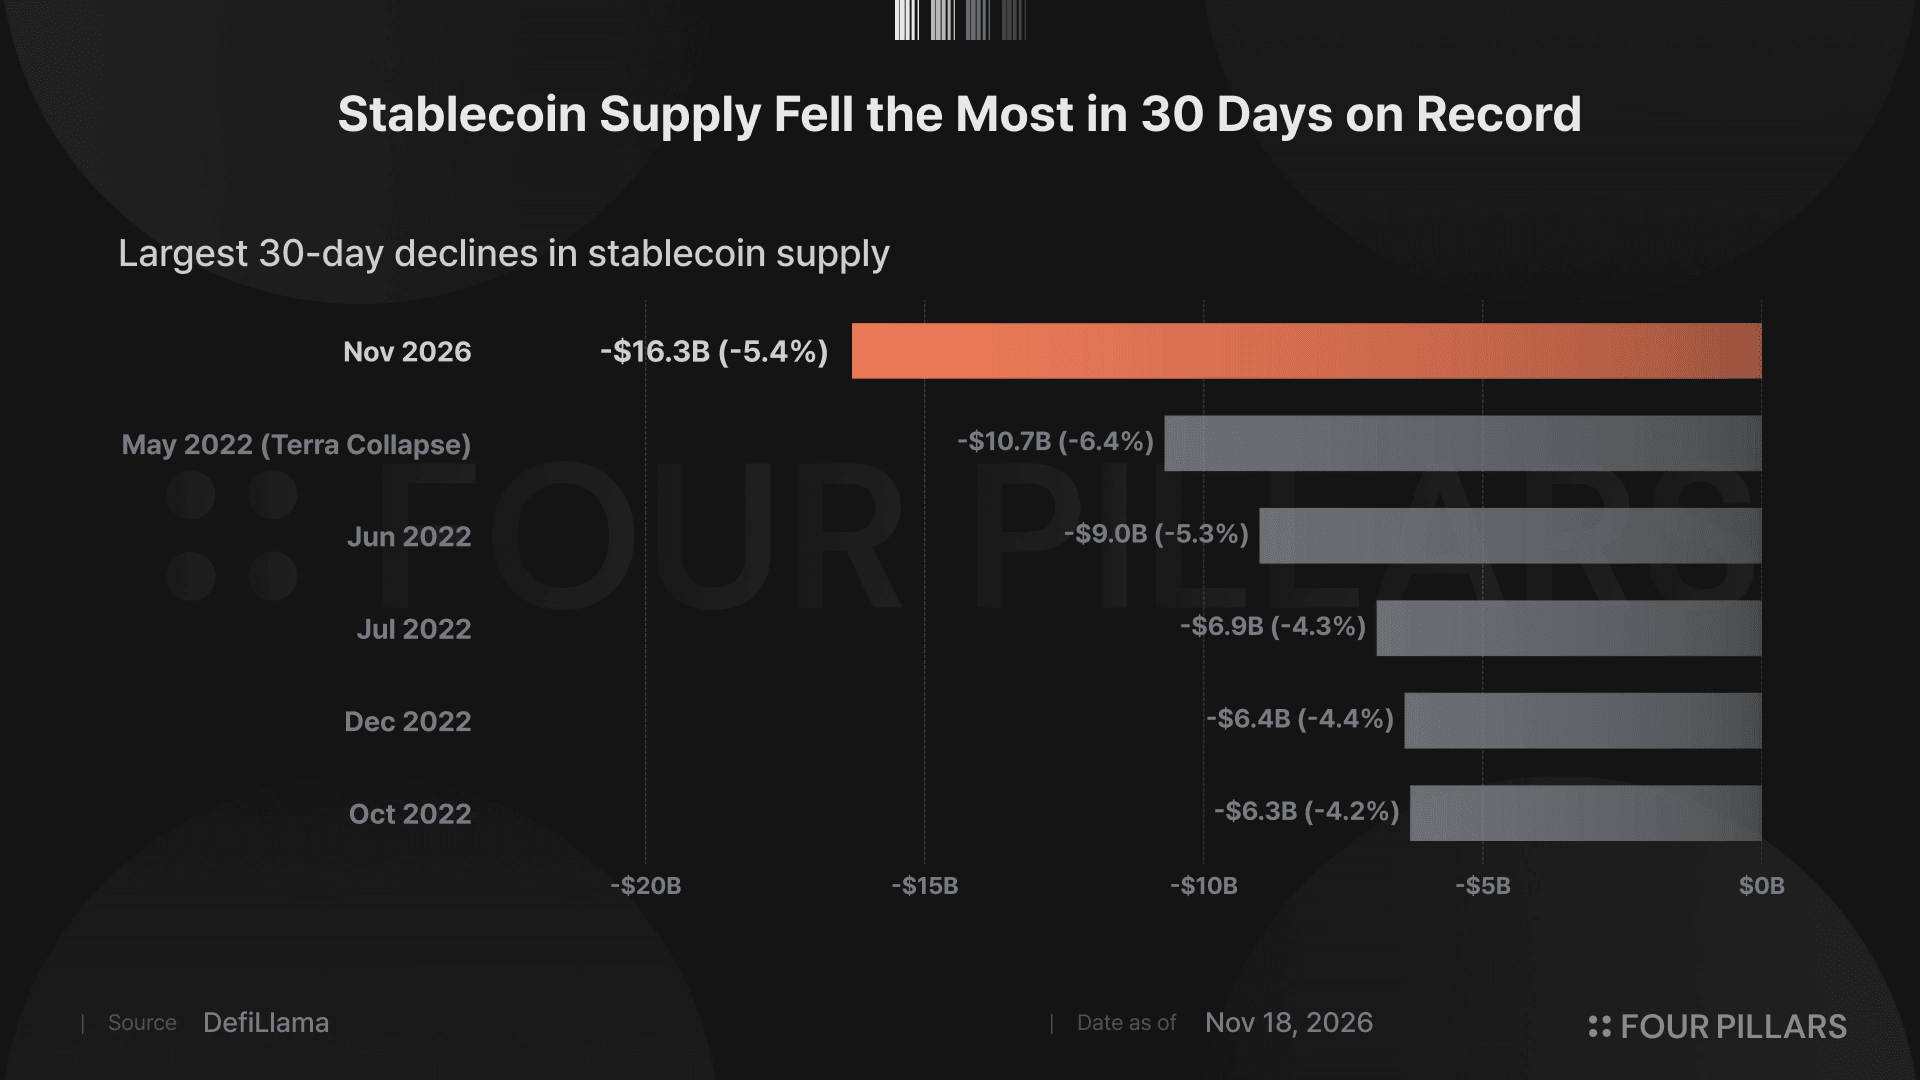
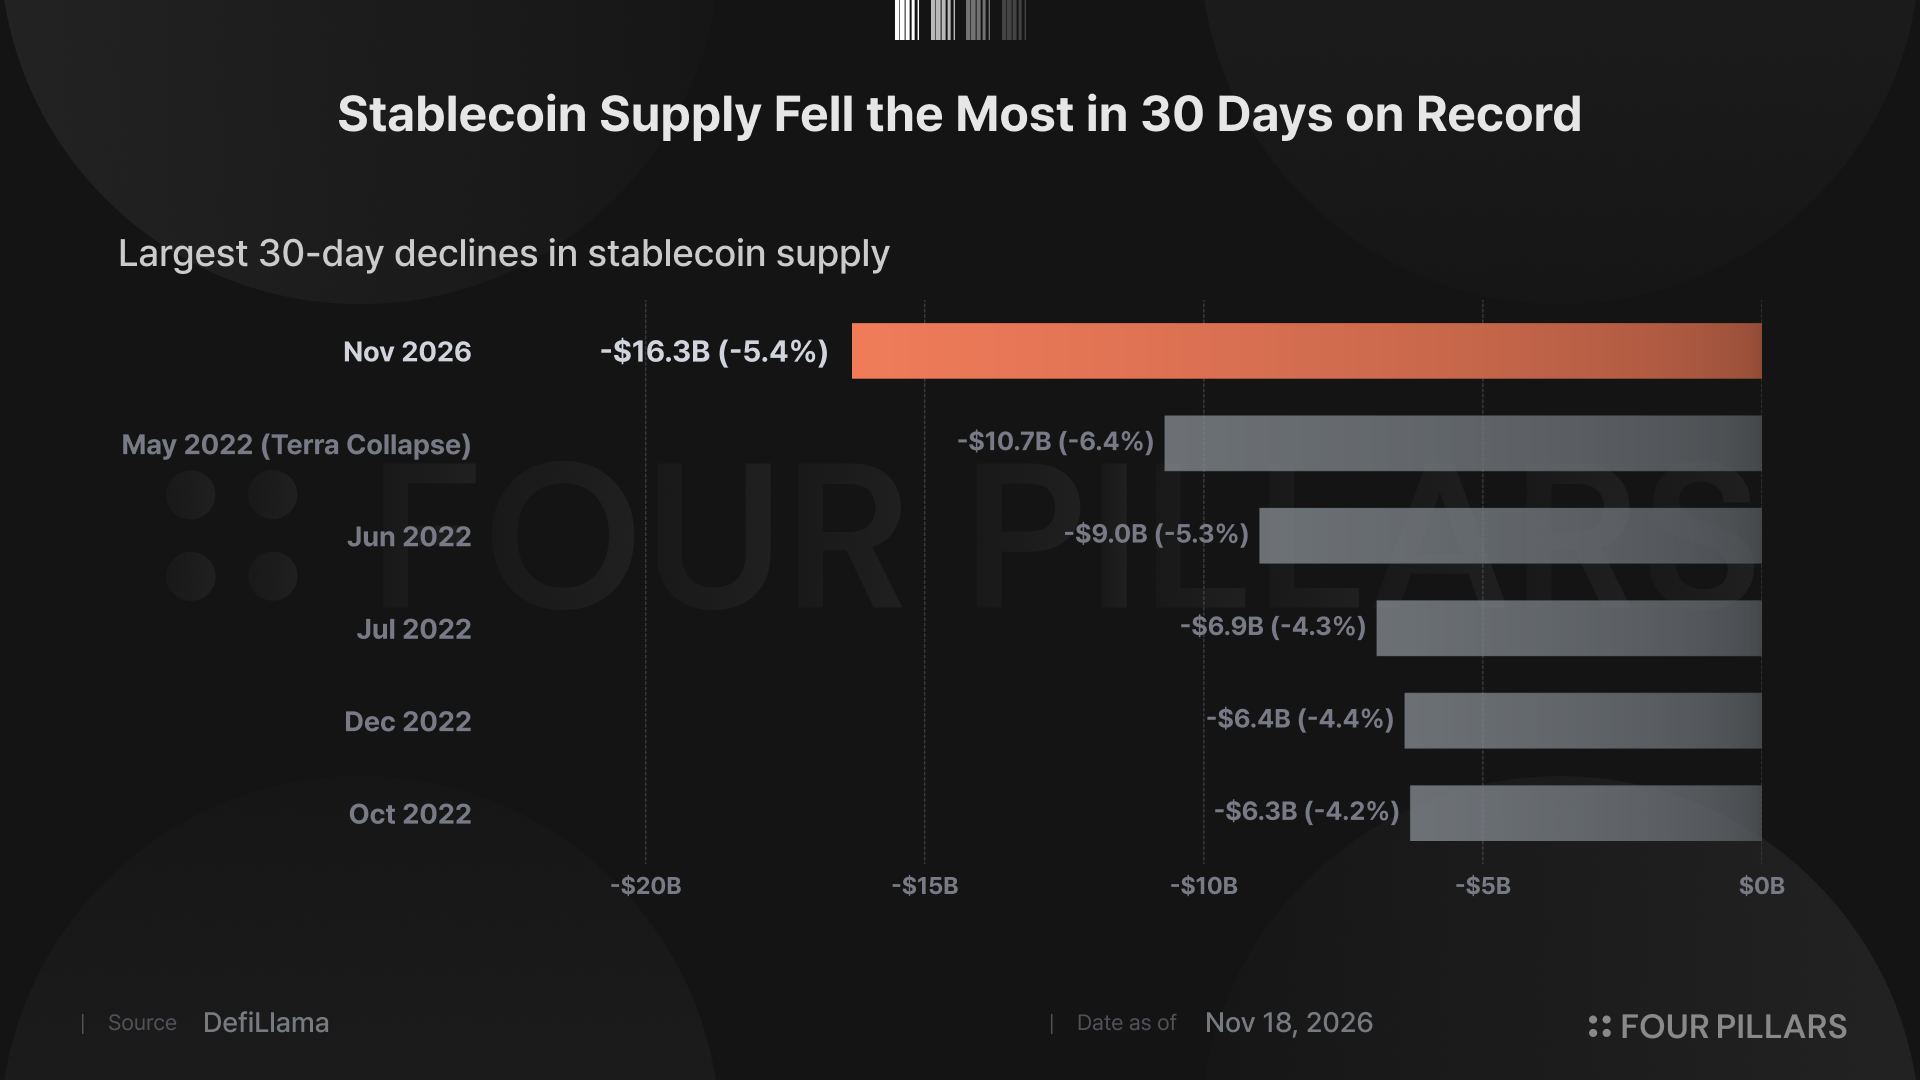
More than half of that decline came in the past month. The rolling 30-day net decline reached about $16.3B on November 14, while supply fell for six consecutive weeks.
For perspective, the latest 30-day decline is larger in dollar terms than anything seen during the 2022 bear market. The percentage decline, at 5.4%, is also the steepest since the 6.4% drop in May 2022, immediately after the Luna collapse.
2. Where the Outflows Came From: Ethereum and Exchange Wallets
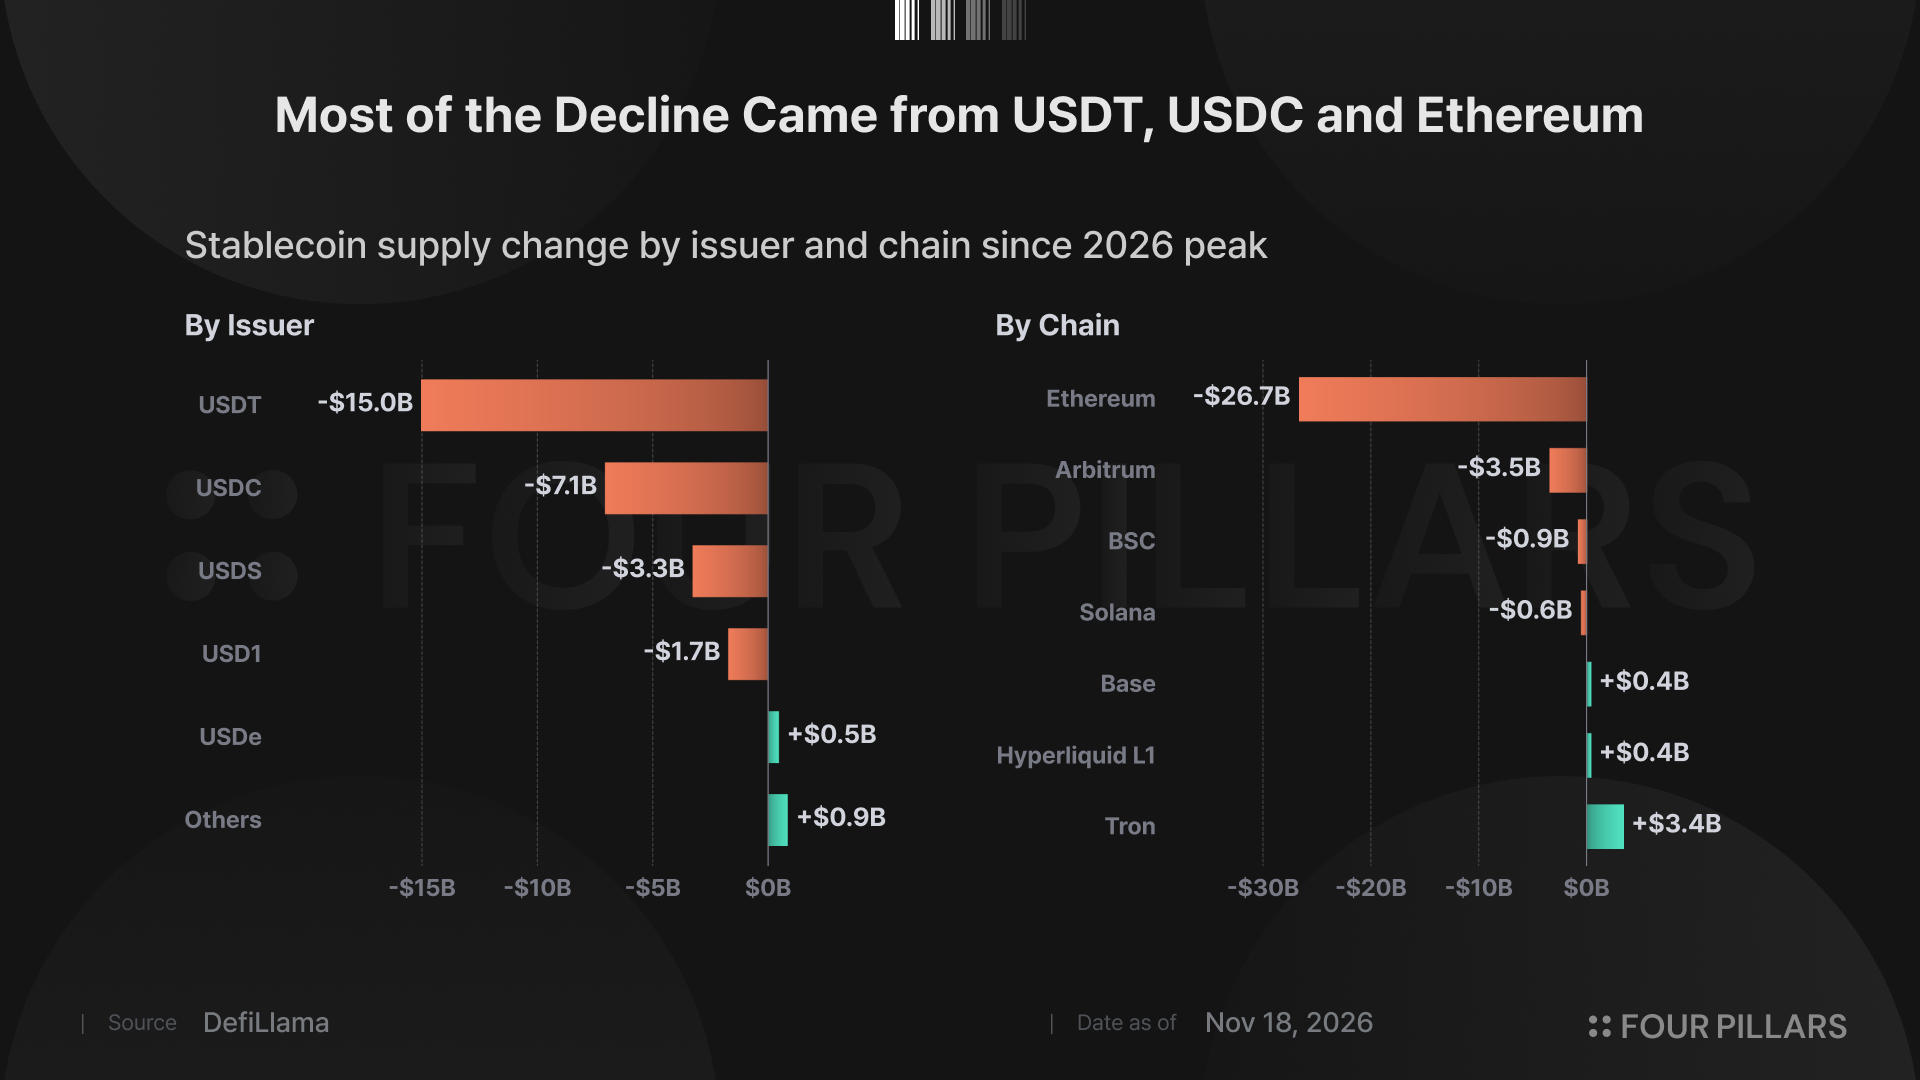
By issuer, USDT accounted for about $15B, or 58%, of the roughly $25.8B in net redemptions since May 20. USDC accounted for another $7.1B, or 27%.
USDT supply fell 7.9% and USDC supply 9.2%, both close to the overall decline of 8.3%. This points to a broad withdrawal of capital waiting to enter the market, rather than a problem with any particular issuer.
By chain, the decline was concentrated on Ethereum, though chain-level figures reflect transfers between chains as well as redemptions. Stablecoin supply on Ethereum has fallen by about $26.7B since May 17. Ethereum also accounted for 75% of the roughly $16.3B decline over the past 30 days.
One surprising exception is Tron, where USDT is widely used for transfers and payments. USDT supply there has grown by about $3.4B since May 17. Dollars used for payments increased even as capital waiting on Ethereum left the market. One reading is that demand for stablecoins as money has held up, while capital held in anticipation of buying crypto has withdrawn.
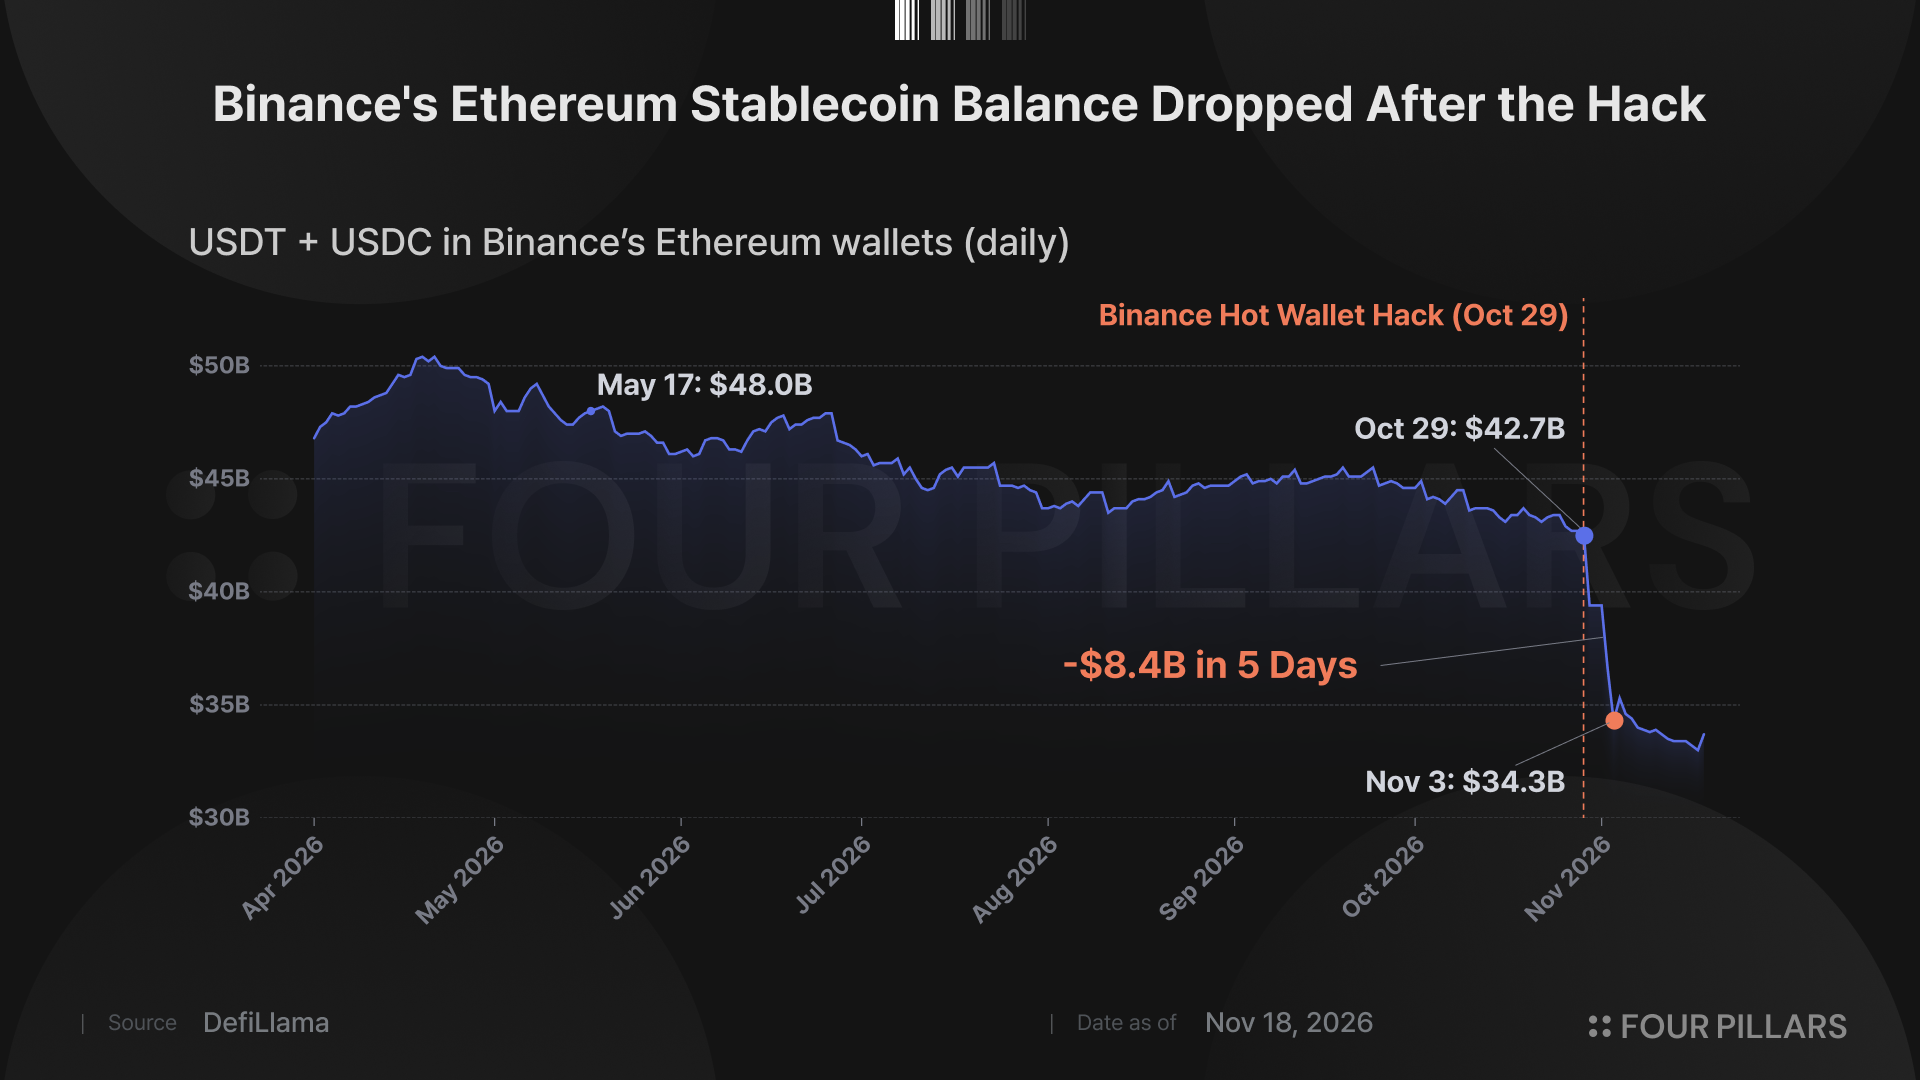
Within Ethereum, exchange wallets accounted for most of the decline. USDT and USDC held in Binance’s Ethereum wallets fell from about $48B on May 17 to $33B on November 17, a drop of roughly $15B. Including OKX, Bybit and other exchanges, exchange wallets accounted for about 77% of Ethereum’s decline.
The timing is telling, too. USDT and USDC balances in those same Binance wallets fell by about $8.4B in the five days following the October 29 hack. Over the past 30 days, Binance accounted for roughly 90% of the decline on Ethereum. Much of November’s drop appears to have come from user withdrawals and Binance’s own fund movements after the hack.
By comparison, major DeFi protocols accounted for just $2.4B, or about 9%, of Ethereum’s decline. The remaining 14% is estimated to have come from personal wallets, bridges, unlabeled exchange wallets and other addresses.
3. Why Capital Left: The Liquidity Cycle Around AI Mega-IPOs
The prospect of further Fed rate hikes, the Binance hack and spot ETF outflows have all been cited as reasons for the decline in stablecoin supply. But Anthropic’s IPO appears to have been the biggest factor. A similar pattern accompanied SpaceX’s listing in June.
US equity markets have seen two major offering events this year. SpaceX raised about $75B when it went public on June 12, and Anthropic began its roadshow on November 10.
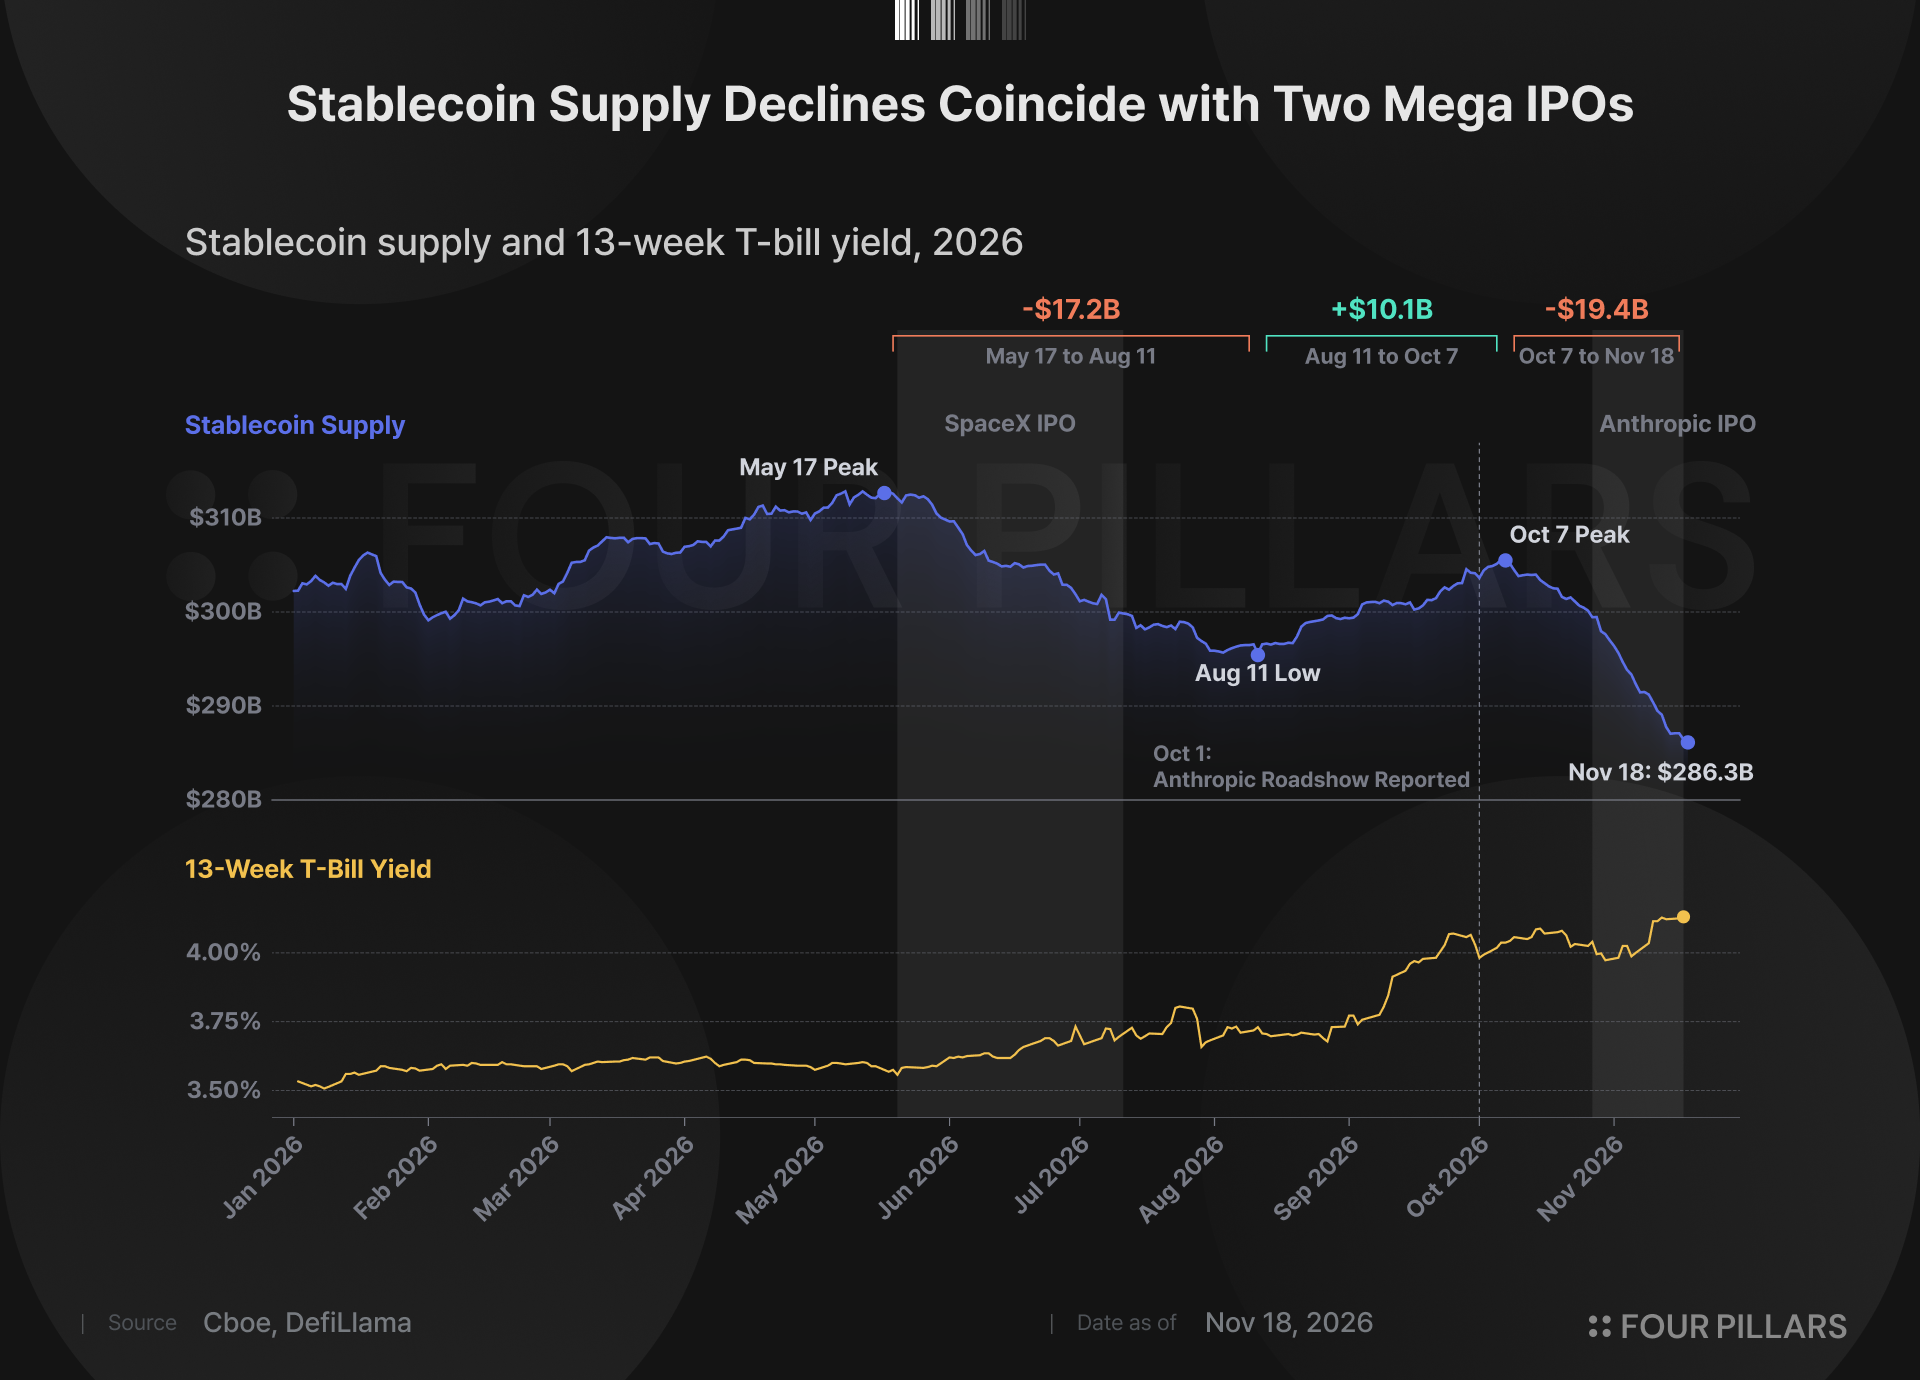
Stablecoin supply peaked on May 17, three days before SpaceX made its S-1 public, then fell by about $17.2B through August 11, two months after the listing. With no crypto-specific event such as a hack during that period, the offering likely drew on capital that had been waiting to buy crypto.
Supply subsequently recovered by about $10.1B through October 7. But shortly after reports of Anthropic’s November roadshow appeared on October 1, it began to fall again. By October 29, just before the hack, about $7.7B had left.
The August–October interval between the two offerings is worth considering as well. The 13-week Treasury yield rose 0.31 percentage points during that period, its largest increase of the year. Yet stablecoin supply grew by $10.1B, and spot BTC ETFs attracted about $5.3B in inflows. Interest rates alone, then, seem insufficient to explain the latest decline.
4. Where Did the Liquidity Go?
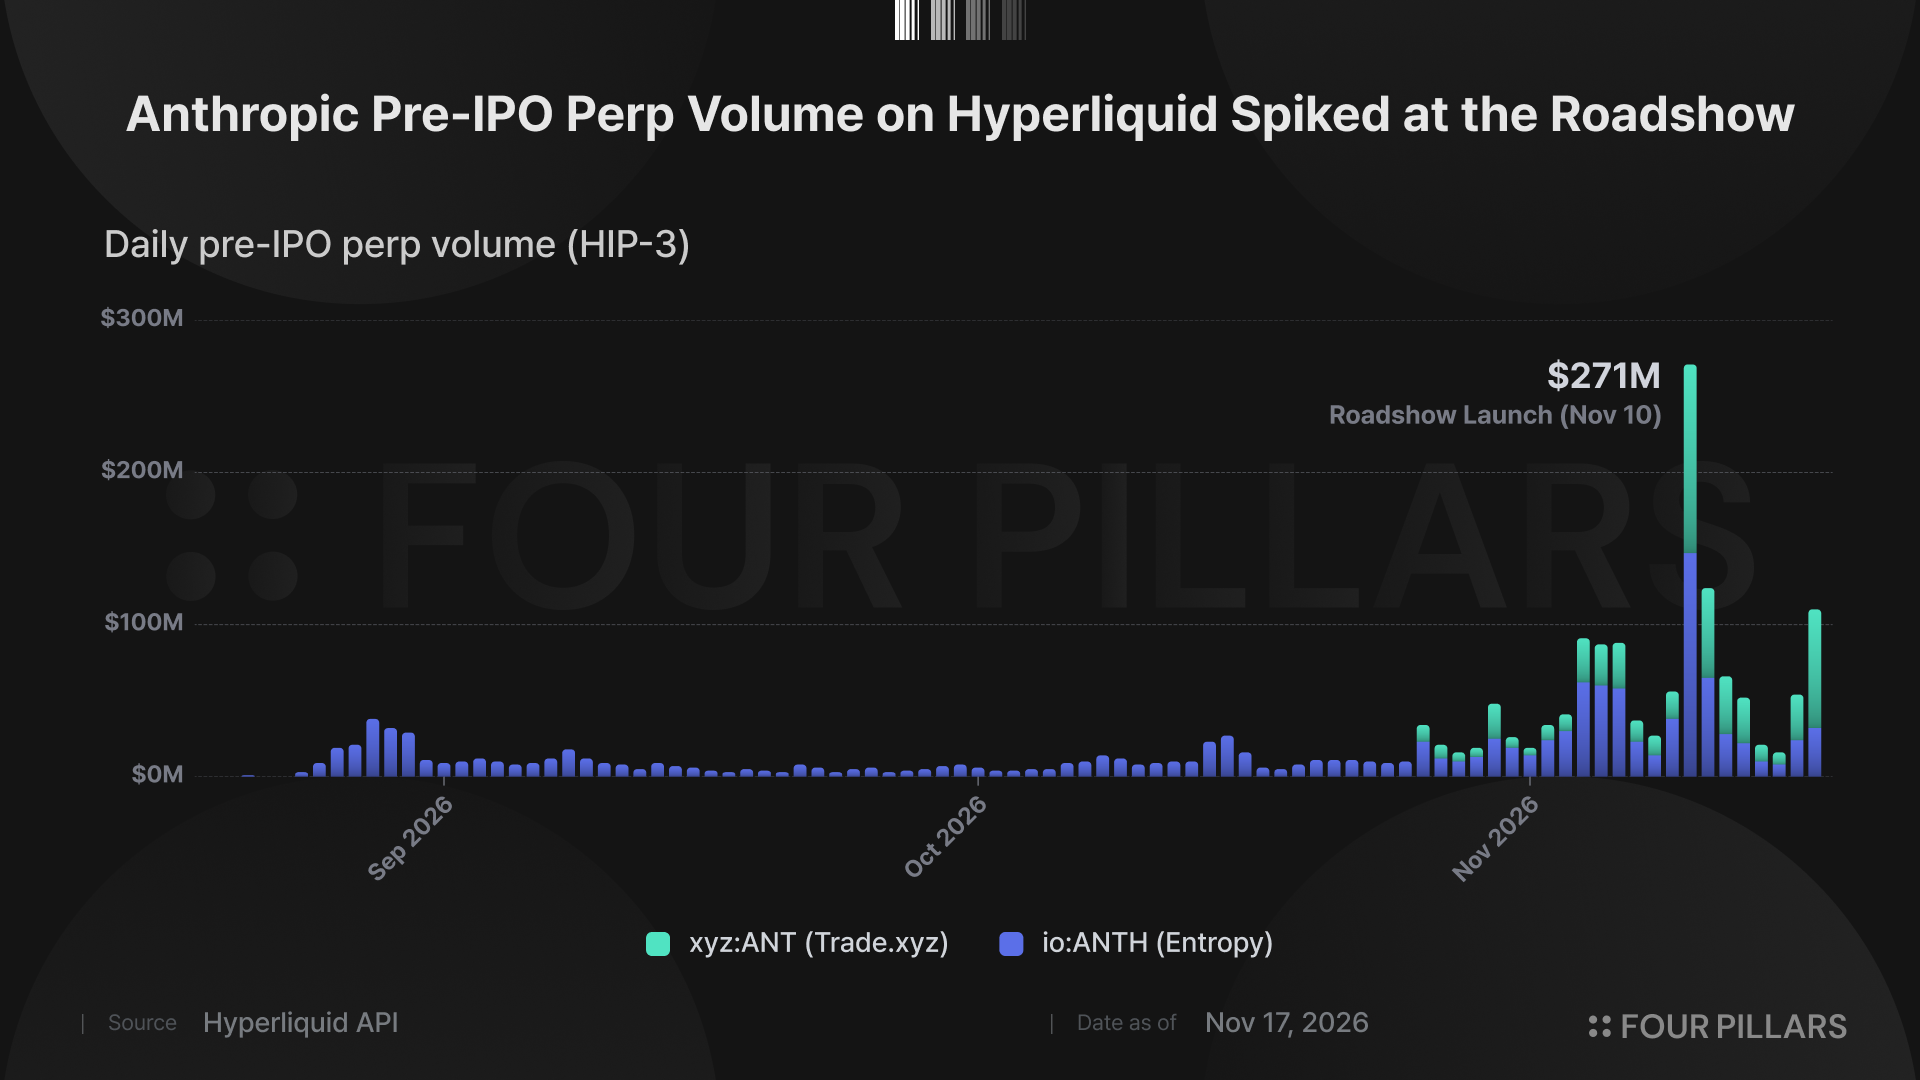
Has liquidity dried up altogether in crypto markets? Not quite. As Anthropic’s offering approached, crypto exchanges launched products linked to the offering, and money quickly followed.
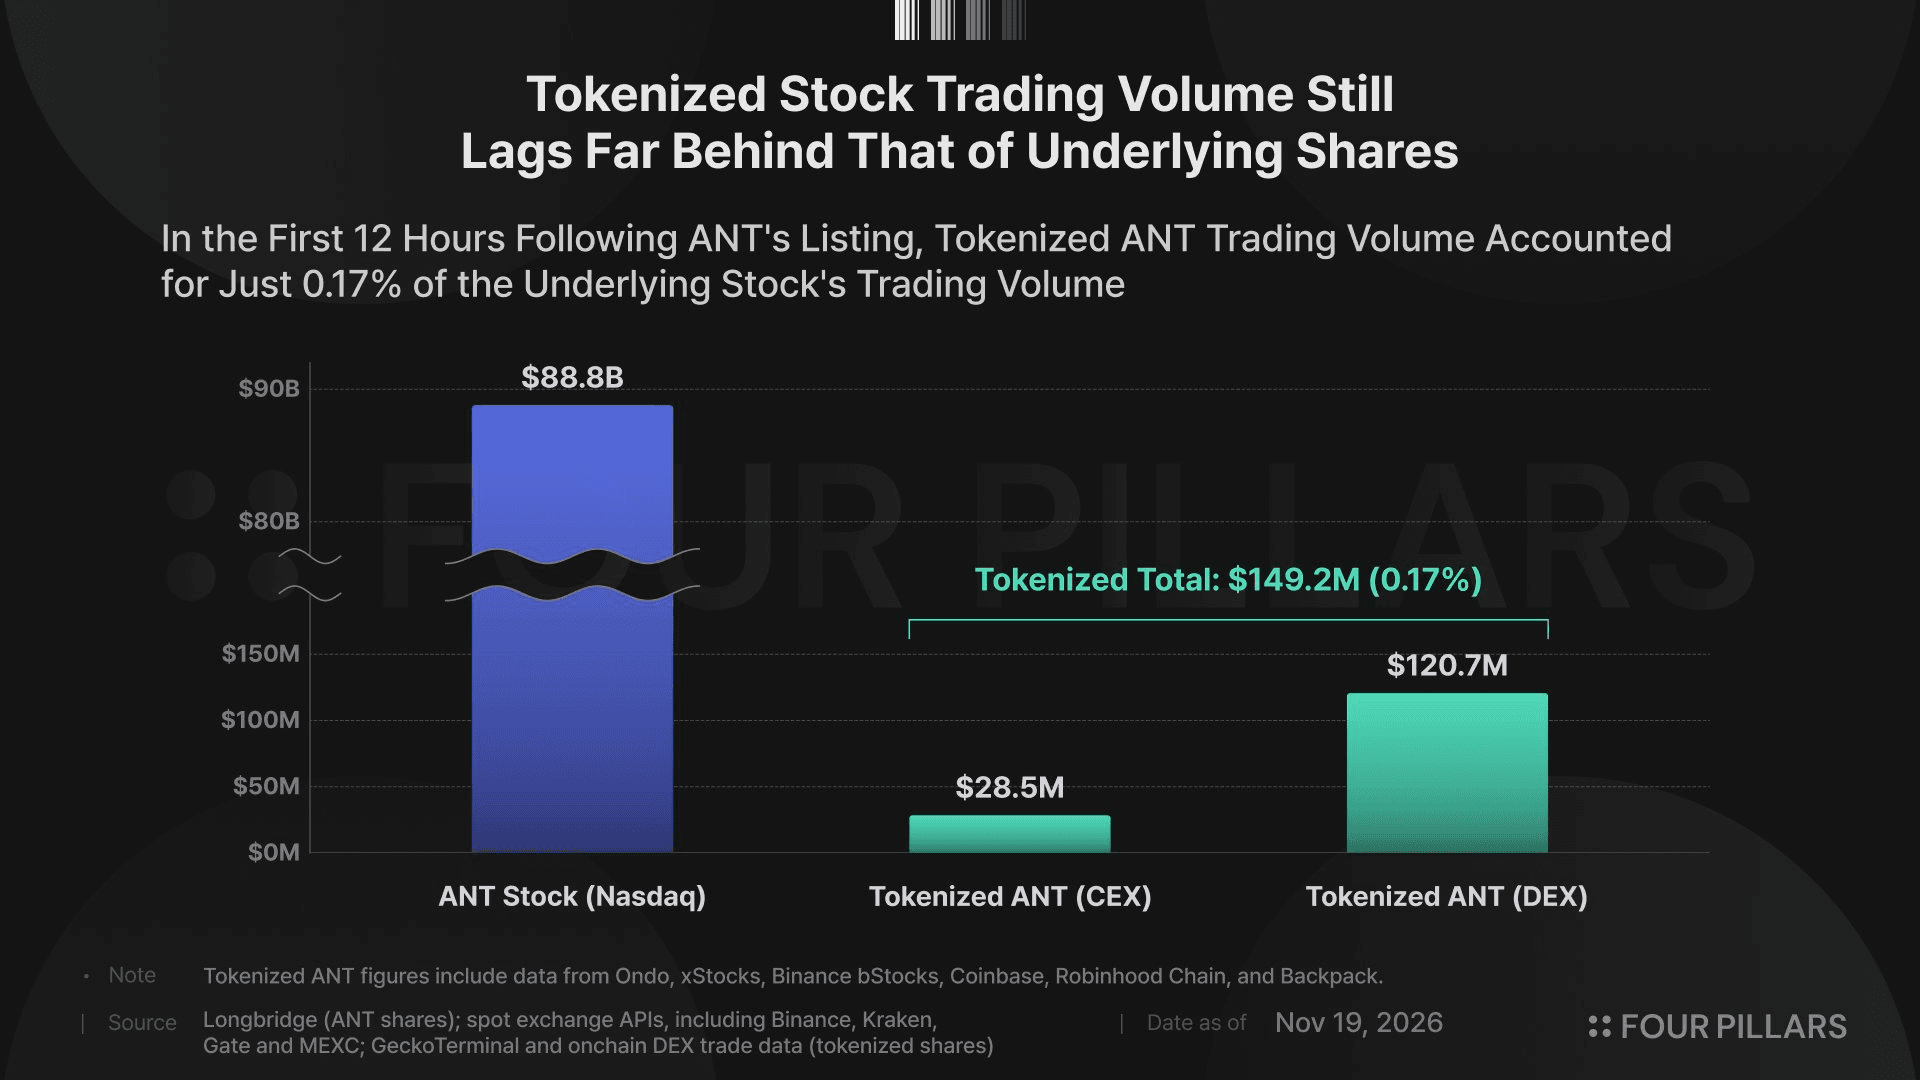
Binance Wallet, in particular, opened subscriptions for Anthropic tokenized securities (ANTx) on November 18, accepting USDC on BNB Chain. The offering reached its 500M USDC cap and closed ahead of schedule.
Perpetual futures offer another indication of where market attention is going, though trading them is different from subscribing to an offering. Anthropic pre-IPO perpetuals on Hyperliquid recorded about $270M in volume on November 10, the first day of the roadshow, nearly ten times their usual level.
5. So Where Does That Leave Crypto?
Over the same period that money was rapidly leaving ETFs and exchange wallets, FOMO was still drawing capital into IPO subscriptions, while pre-IPO futures attracted event-driven trading. This looks less like liquidity drying up than investors choosing traditional financial assets, such as newly listed stocks, over crypto.
Of course, this analysis establishes correlation, and there are only two offerings to compare. November also brought the hack, expectations of higher interest rates and the US election results, making it difficult to isolate the offering’s effect.
Still, the pattern raises an uncomfortable and important question for crypto. If investors can buy quality stocks directly onchain and through exchanges, why buy crypto at all? That question has been building for some time. This offering may be a case where the possibility is beginning to show up in the numbers.
There is also room to read those same numbers differently. Offered as tokenized stock, the Anthropic subscription gave investors outside the US access to a mega-IPO. USDT on Tron, where transfers and payments are major uses, grew even as total stablecoin supply contracted.
Demand for blockchain as financial infrastructure continues to grow, regardless of coin prices. This seems a good time to take a step back and consider why crypto assets are needed, where they belong in the broader capital markets, and how the use of blockchain infrastructure relates to the value of the coins themselves.
The author of this report may have personal holdings or financial interests in assets or tokens discussed herein. However, the author affirms that no transactions have conducted using material non-public information obtained in the course of research or drafting. This report is intended solely for general information purposes and does not constitute legal, business, investment, or tax advice. It should not be used as a basis for making any investment decisions or as guidance for accounting, legal, or tax matters. Any references to specific assets or securities are made for informational purposes only and should not be construed as an offer, solicitation, or recommendation to invest. The opinions expressed herein are those of the author and may not reflect the views of any affiliated institutions, organizations, or individuals. The opinions and analyses expressed herein are subject to change without prior notice. In addition, beyond the individual disclosures included in each report, Four Pillars, may hold existing or prospective investments in some of the assets or protocols discussed herein. Furthermore, FP Validated, a division of Four Pillars, may already be operating as a node in certain networks or protocols discussed herein or may do so in the future. Please see below links in the footer for FP Validated's participating network disclosures and for broader disclosure details.