
Table of Contents
- 1. Executive Summary
- 1.1 Tokenization Today: The Newspaper-on-a-Website Phase
- 2. Introducing the State of Tokenization Portal
- 2.1 Six Findings That Define the Gap Between Hype and Maturity
- 3. Background & Motivation
- 3.1 Every Bank Has a Tokenization Strategy. Few Have Infrastructure.
- 4. Methodology
- 4.1 The Lifecycle of an Asset
- 4.2 Three Dimensions for Tokenization Progress Index (TPI)
- 4.3 The Scoring Rubric: What Each Level Means
- 4.4 Three Tiers: Wrapper, Hybrid, and Native
- 5. The Data
- 5.1 The Market Is in the Wrapping Phase, with Transition to Hybrid
- 5.2 Asset Launches and Market Size Hit New High in 2025
- 5.3 Stablecoins Hold $293B — 91.6% of Total Market Value
- 5.4 Institutions Drove Treasuries to $12B, Making It the 2nd Biggest Asset On-Chain
- 5.5 Growth Diverges: Some Asset Classes Saturated While Others Just Emerged
- 5.6 Market Size and TPI Score Begin to Move Together
- 5.7 91% of Tokenized Assets Are Still Gated Issuance & Redemption
- 5.8 Private Credit Leads DeFi Utilization at 64.3%
- 5.9 Tokenization Is More Concentrated Than It Looks
- 5.10 TPI Score by Chain: When Permissioned Means Less Native
- 6. The Tokenization Playbook
- 6.1 Wrap, Connect, Compose, Originate
- 7. Conclusion & Outlook
- 7.1 Tokenization Should Be Measured by Outcomes, Not Just Packaging
- 7.2 The Most Valuable Use Cases Require Redesign, Not Replication
- 7.3 The Wrapper Market Is Not a Bug — It's a Regulatory Equilibrium
- 7.4 Better Distribution Does Not Create Demand for a Weak Asset
- 7.5 Opaque Asset Classes Could Benefit the Most from On-Chain Transparency
- 7.6 The “Perpification” vs Tokenization Debate
- 8. Final Thoughts
- 9. Appendix
Tracking 593 assets across a $320.6B tokenization market
Every major bank now has a tokenization strategy. But how much is real infrastructure? How much is a “newspaper-on-a-website”?
We built the State of Tokenization portal and Tokenization Progress Index (TPI) to find out.
*You can check the full article in the below link
https://panteracapital.com/state-of-tokenization-q1-2026-pdf/
1. Executive Summary
1.1 Tokenization Today: The Newspaper-on-a-Website Phase
Tokenization is one of the defining narratives of institutional crypto in 2026. Every major bank, custodian, and asset manager now has a tokenization strategy. But market activity alone does not tell us whether tokenized assets are realizing blockchain’s full potential or limited to digital wrappers around traditional infrastructure.
Our report examines 593 tokenized assets across 11 asset classes, representing roughly $321.1B in tracked market value. We score 542 live assets using Pantera Capital's Tokenization Progress Index (TPI), a framework built around three dimensions of on-chain maturity: Issuance & Redemption, Transferability & Settlement, and Complexity & Composability. We evaluate each dimension on a scale of 1 to 5 to create a composite TPI score.
Across the market, the average composite TPI is 2.04 out of 5. Using our tiering framework, roughly 77.6% of tracked assets fall into the Wrapper bucket, while 11.1% qualify as Hybrid and only 2.7% reach the Native tier.
This framework is not meant to dismiss today’s Wrapper products. In many cases, they reflect what current customers, issuers, and regulators are able to digest today: familiar structures, tighter controls, and incremental efficiency gains in distribution, settlement, and access. The point of the TPI is not to penalize that starting point, but to identify where on-chain systems begin to meaningfully replace off-chain processes — and where tokenized assets begin to unlock functionality that traditional infrastructure cannot easily provide.
The early phase of internet media was newspapers copying and pasting articles onto websites. Delivery speed improved. Availability expanded. But the format was identical — the same product on a new distribution rail. None of it predicted what internet-native media would actually look like: podcasts, algorithmic feeds, interactive visualizations, creator platforms, formats that simply couldn’t have existed in print.
Tokenization is in its newspaper-on-a-website phase. The $321 billion market has proven that assets can be distributed on-chain. It has not yet produced the native financial instruments that will define what tokenization actually becomes: programmable compliance, autonomous collateral management, real-time yield optimization, embedded governance, unbundling of assets into risks and revenue streams. Those products cannot be wrapped from off-chain originals. They have to be originated on-chain.
What moved the internet beyond the newspaper-on-a-website phase was not ideology, but product pressure: faster feedback loops, new user behavior, new monetization models, and formats that were only possible in the new medium. Tokenization will likely evolve the same way. The next phase will not be defined simply by putting more assets on-chain, but by creating financial products that are more useful because they are on-chain: assets that settle continuously, optimize collateral in real time, route yield programmatically, embed compliance into code, and separate ownership, cash flows, and risk into new financial building blocks.
2. Introducing the State of Tokenization Portal
To track the state of tokenization as it emerges from the newspaper phase, we launched the State of Tokenization portal - a quarterly-updated dashboard for the industry. The portal brings together structured market data from sources such as RWA.xyz and DeFiLlama, together with Pantera's Tokenization Progress Index methodology and asset-level scoring, to provide an interpretable layer of how tokenization is evolving across issuers, platforms, asset classes, and jurisdictions.
2.1 Six Findings That Define the Gap Between Hype and Maturity
Issuance is mostly gated. Issuance & Redemption averages just 1.82, the lowest of the three TPI dimensions. 494 of 542 scored assets (91.1%) still score 1 or 2, meaning admin-controlled minting and custodian-mediated exits remain the norm. Easy issuance with constrained redemption is the state of the market.
Transfer is improving faster than issuance. Transferability & Settlement is the strongest dimension at 2.29, and 205 assets (37.8%) now reach score 3, suggesting a growing middle ground where assets can move on-chain even if the chain is not yet the sole authoritative ledger. But only 35 assets (6.5%) reach score 4 or 5, so on-chain-sovereign settlement remains rare.
DeFi composability is concentrated. Only 65 of 542 scored assets (12.0%) reach Complexity & Composability >= 3, the threshold for meaningful DeFi integration. In absolute terms, stablecoins dominate with roughly $26.4B currently locked in DeFi. But on a category-penetration basis, Private Credit (21.4%) and Actively-Managed Strategies (19.6%) stand out as the non-stablecoin categories with the highest share of value already active on-chain.
Stablecoins are the only category operating at real scale. Stablecoins average roughly 2.67 on composite TPI, materially above the market average, and remain the only asset class with both large economic scale and meaningful on-chain utility. Everything else is still early by comparison, even where growth has accelerated.
The market is getting wider, not deeper. The market recorded 168 launches in 2025, up from 78 in 2024, while total tracked value rose from roughly $200.6B in 2024 to $313.7B in 2025 and $321.1B in the latest 2026 snapshot. Tokenization is clearly broadening, but the TPI data shows that new issuance is still arriving faster than true infrastructure depth.
Scale and progress are starting to move together, but only loosely. At the asset-class level, there is now a visible directional relationship between market value and average TPI: categories with larger scale tend to be somewhat more mature. But that relationship is still shallow. Capital is beginning to favor stronger on-chain structures, yet most of the market remains clustered in low-to-middle progress bands rather than in genuinely native designs.
3. Background & Motivation
3.1 Every Bank Has a Tokenization Strategy. Few Have Infrastructure.
BlackRock’s BUIDL fund crossed $2B in AUM in April 2025. Franklin Templeton’s FOBXX has been live on-chain since 2021. JPMorgan’s Kinexys processes billions in daily transactions. The headlines suggest an industry in rapid transformation.
But these headlines measure surface-level metrics. A tokenized asset that lives on a permissioned ledger, requires manual OTC redemption, cannot be transferred without issuer approval, and has no DeFi integration is functionally identical to a traditional security with a blockchain receipt attached. The token adds a data layer but changes nothing about how the asset actually works.
This report introduces a framework for distinguishing between early-stage tokenization and more functionally on-chain market infrastructure. We built a database of 593 tokenized assets, aggregating the best available public information from sources including DeFiLlama and RWA.xyz, and evaluated all assets with visible market value using a consistent scoring framework. We scored each asset across three dimensions of on-chain maturity to answer a practical question: how far has the tokenization market progressed, and where is it still in its early “newspaper-on-a-website” phase?
In that sense, this report is less about asking whether tokenization is real, and more about asking which products are still digital replicas of legacy finance and which are beginning to develop features that only on-chain markets can support.
The intended audience is Heads of Digital Assets at banks and wealth managers — the people making build-vs-buy decisions about tokenization infrastructure. The data here should help them benchmark their own products against the market and identify where genuine competitive moats are forming. It is also a resource for crypto-native builders evaluating which asset classes and lifecycle stages present the largest gaps between current state and what’s possible.
4. Methodology
4.1 The Lifecycle of an Asset
We model the lifecycle of a tokenized asset as a linear flow. It begins with Originate & Structure — the off-chain legal setup (entity formation, SPV/trust, registration). This stage is excluded from scoring for now, not because it is unimportant, but because it remains too jurisdiction-specific and too unsettled to score consistently across the market today. In the long run, that should change. As regulation becomes clearer and market structure standardizes, legal design will become a more meaningful differentiator between tokenized products. Over time, the degree to which ownership rights, transfer restrictions, insolvency treatment, and redemption claims are natively reflected in the legal architecture will matter just as much as the on-chain mechanics themselves. For now, we treat legal structure as essential context, while focusing the TPI on the operational dimensions that can already be compared more cleanly across assets.
The lifecycle flow below illustrates the progression from off-chain origination through the three scored on-chain stages:
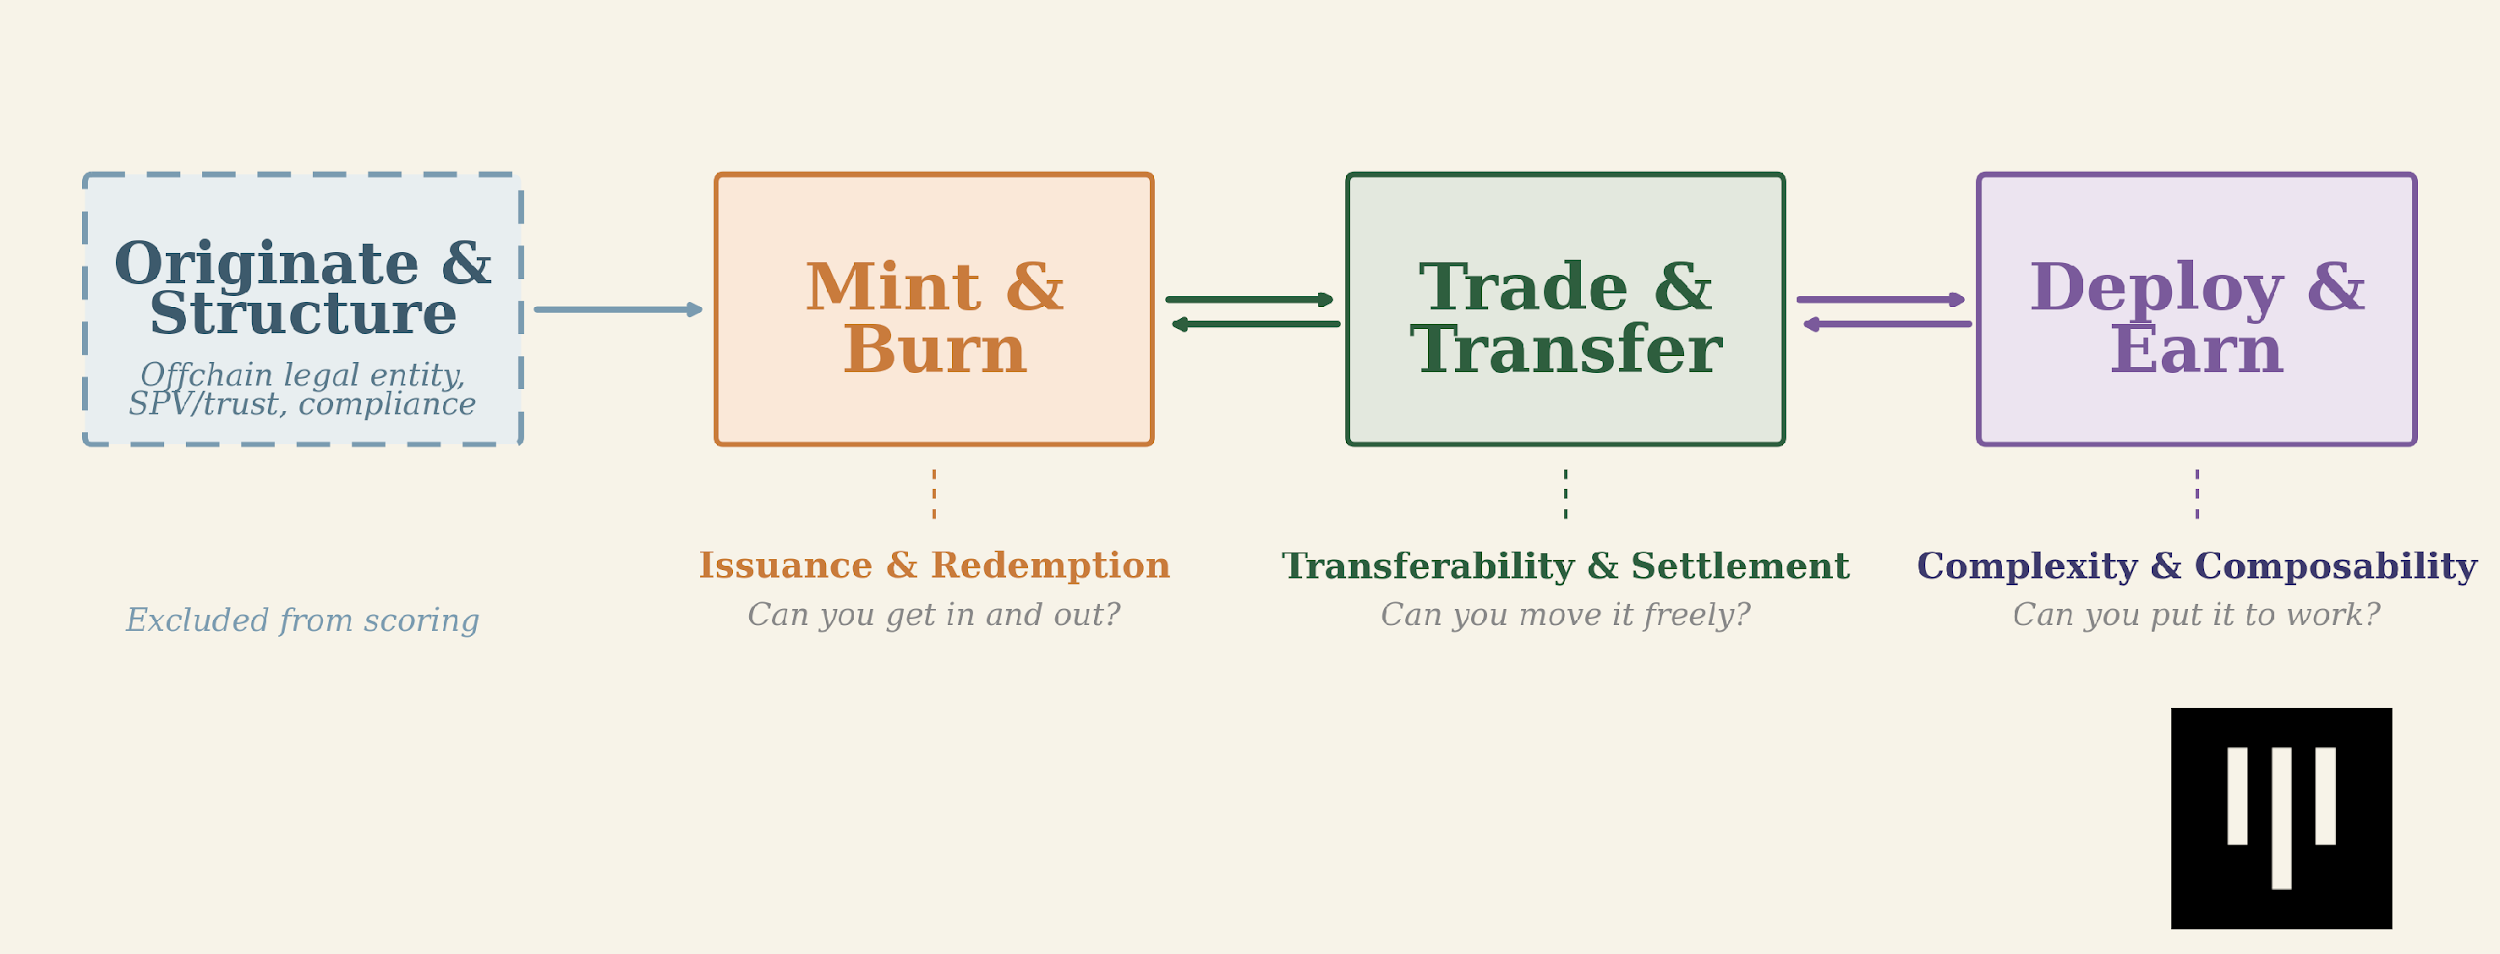
Fig. 1. The Tokenized Asset Lifecycle & TPI Dimensions
The three scored stages flow left to right: Mint & Burn (the token’s birth and death), Trade & Transfer (how freely it moves and who holds the authoritative ledger), and Deploy & Earn (how much autonomous infrastructure backs it and how deeply it integrates into DeFi). Each builds on the previous — you can’t deposit a token into Aave if you can’t transfer it to the Aave contract.
4.2 Three Dimensions for Tokenization Progress Index (TPI)
Derived from these three key stages, we evaluate the autonomy and on-chain nativity level for the 3 aspects:
- Issuance & Redemption — can assets be minted and exited with more autonomous and symmetrical on-chain mechanics?
- Transferability & Settlement — is the chain the authoritative management and settlement layer, or just a mirrored record of an off-chain ledger?
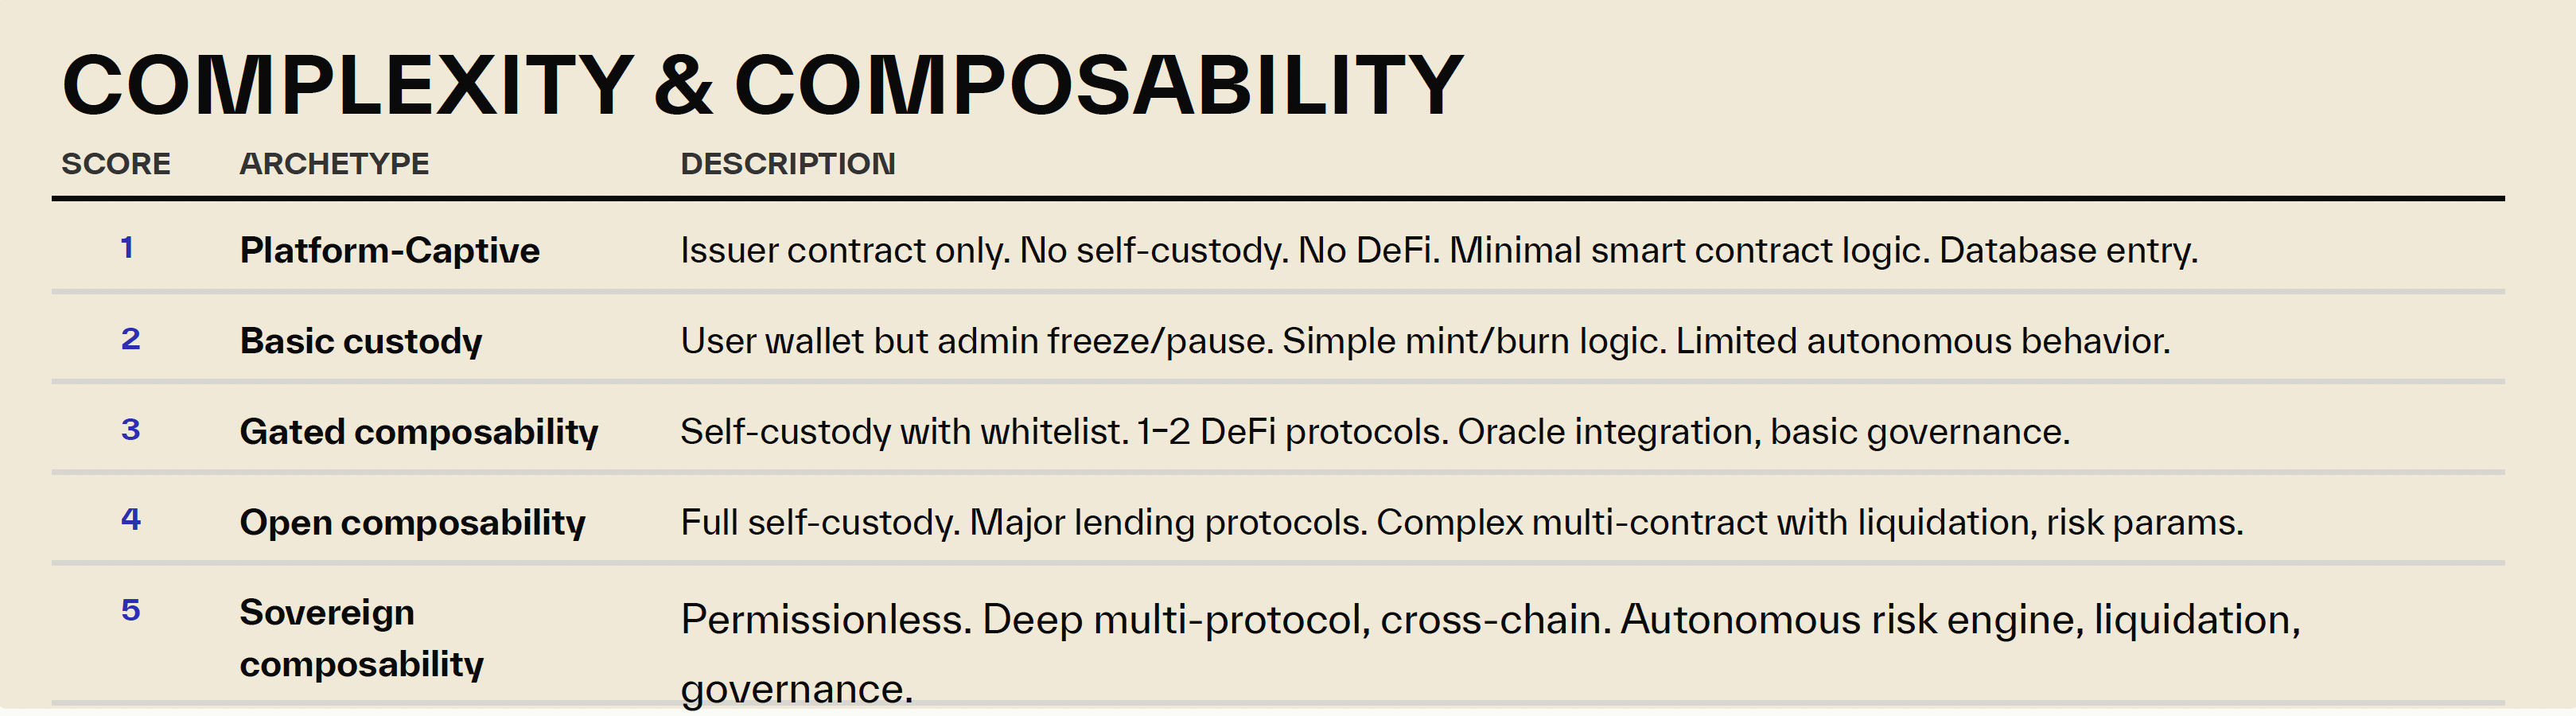
- Complexity & Composability — can the asset be put to work on-chain via smart contract infrastructure, with composability for yield?
The TPI scores each asset on three independent dimensions, each rated 1-5. The dimensions are designed to be orthogonal: a token can score high on transferability but low on composability, or vice versa. The composite score is the average of all three.
4.3 The Scoring Rubric: What Each Level Means
To move from concept to measurement, we translate the tokenized asset lifecycle into a scoring framework. The objective is not to reward complexity for its own sake, but to isolate the parts of tokenization where on-chain systems actually begin to replace off-chain processes. Each rubric is designed to capture a different form of progress: whether issuance and exit become more symmetrical, whether the chain becomes the authoritative movement and settlement layer, and whether the asset can be deployed into programmable on-chain infrastructure.
Table 1. Issuance & Redemption Scoring Rubric
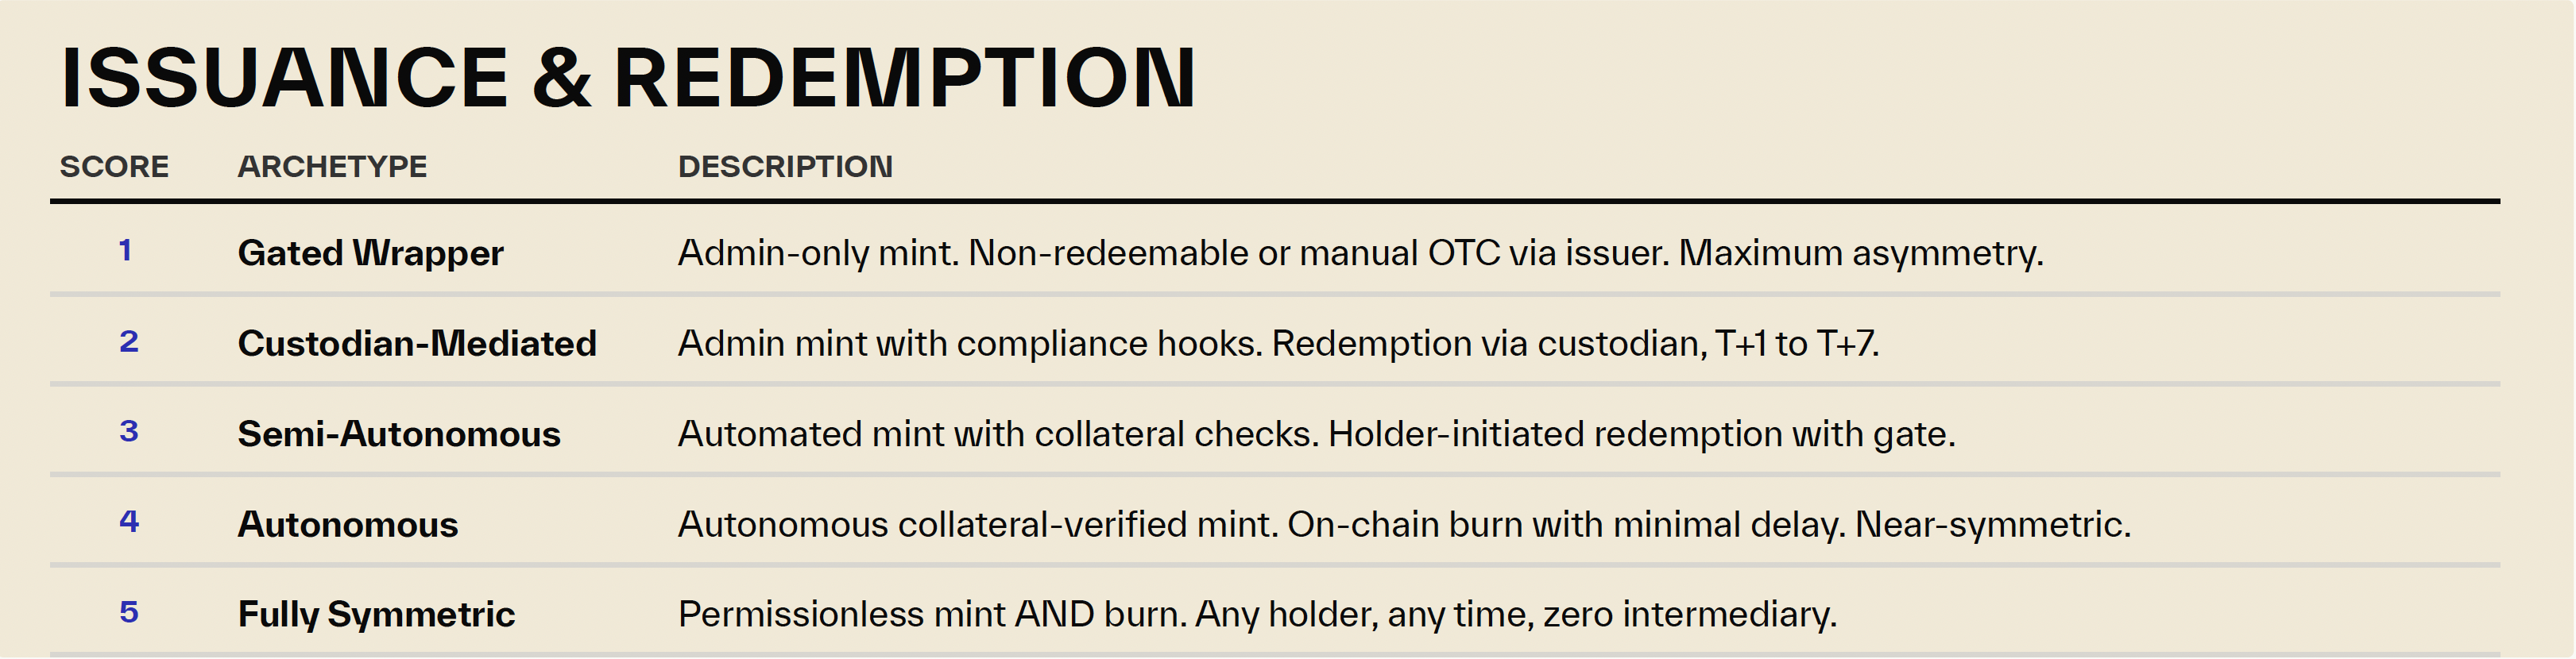
Table 2. Transferability & Settlement Scoring Rubric
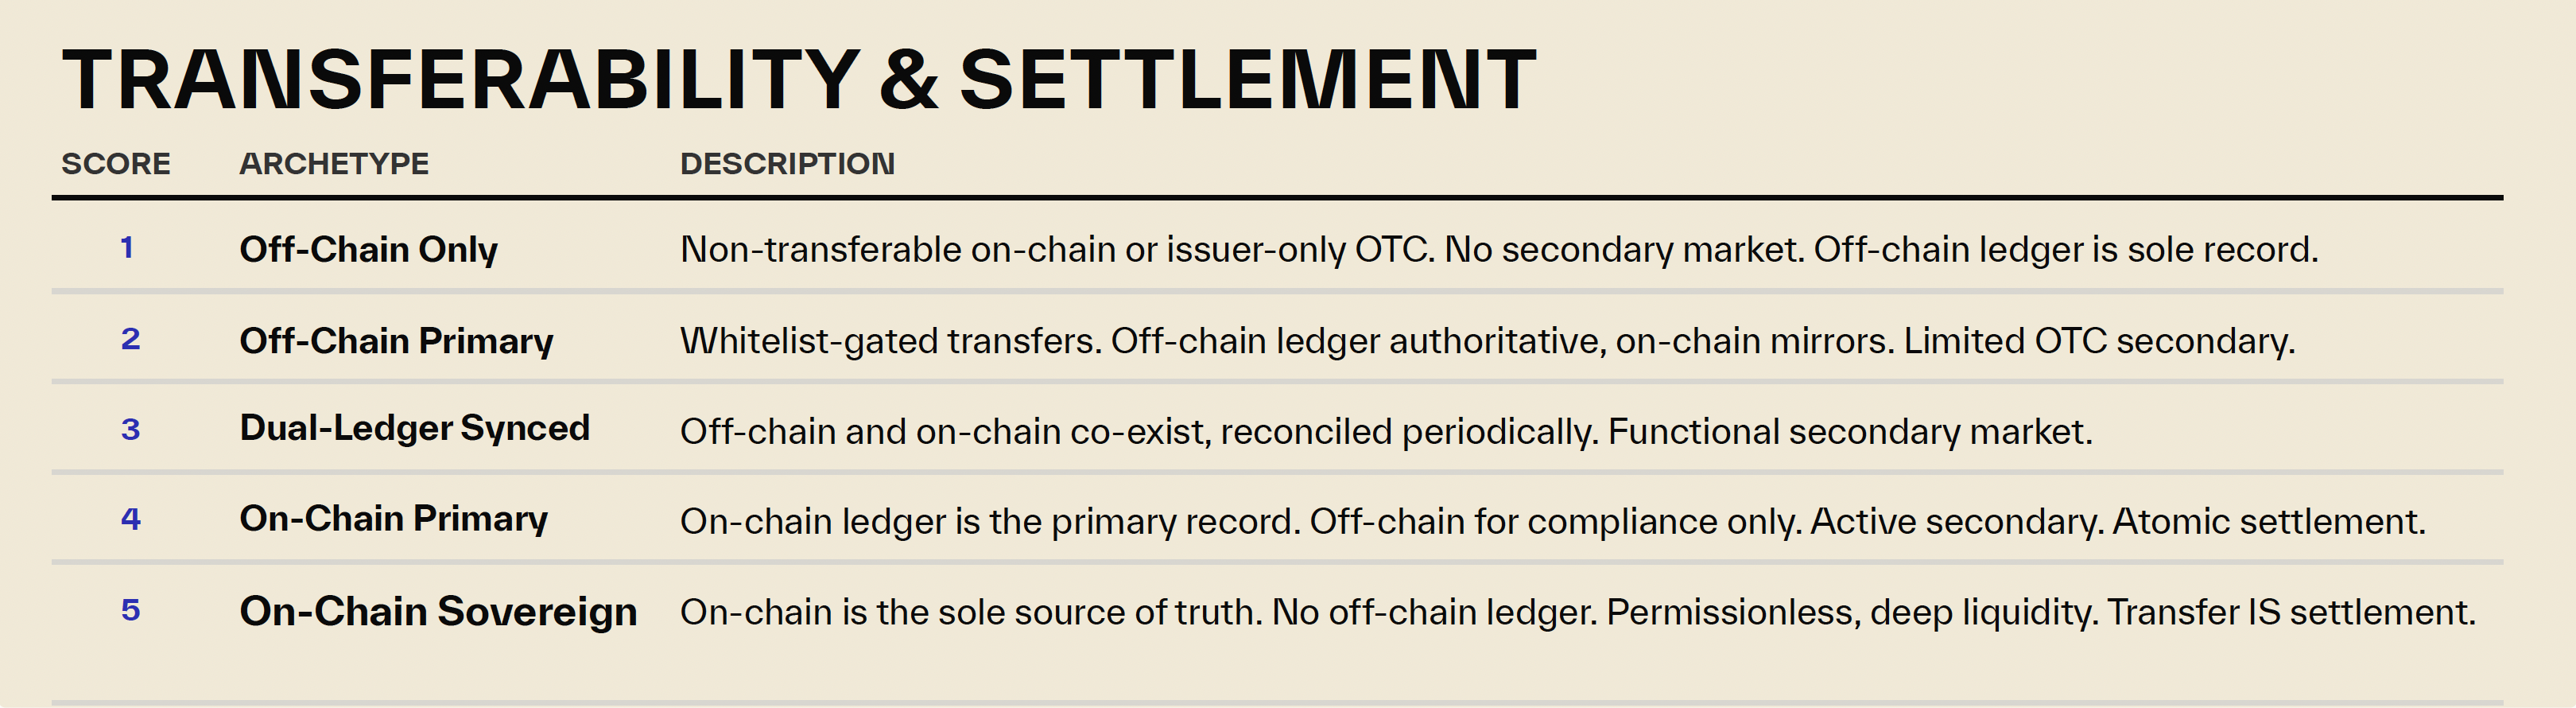
Table 3. Complexity & Composability Scoring Rubric
4.4 Three Tiers: Wrapper, Hybrid, and Native
To make the TPI easier to interpret at the market level, we group assets into three broad tiers based on their average composite score across the three dimensions. The goal of this taxonomy is to translate individual rubric scores into a more intuitive view of where tokenized assets actually sit on the path from simple digital wrappers to genuinely native on-chain financial products.
We use the composite TPI averaged across 3 dimensions as the tiering guide:
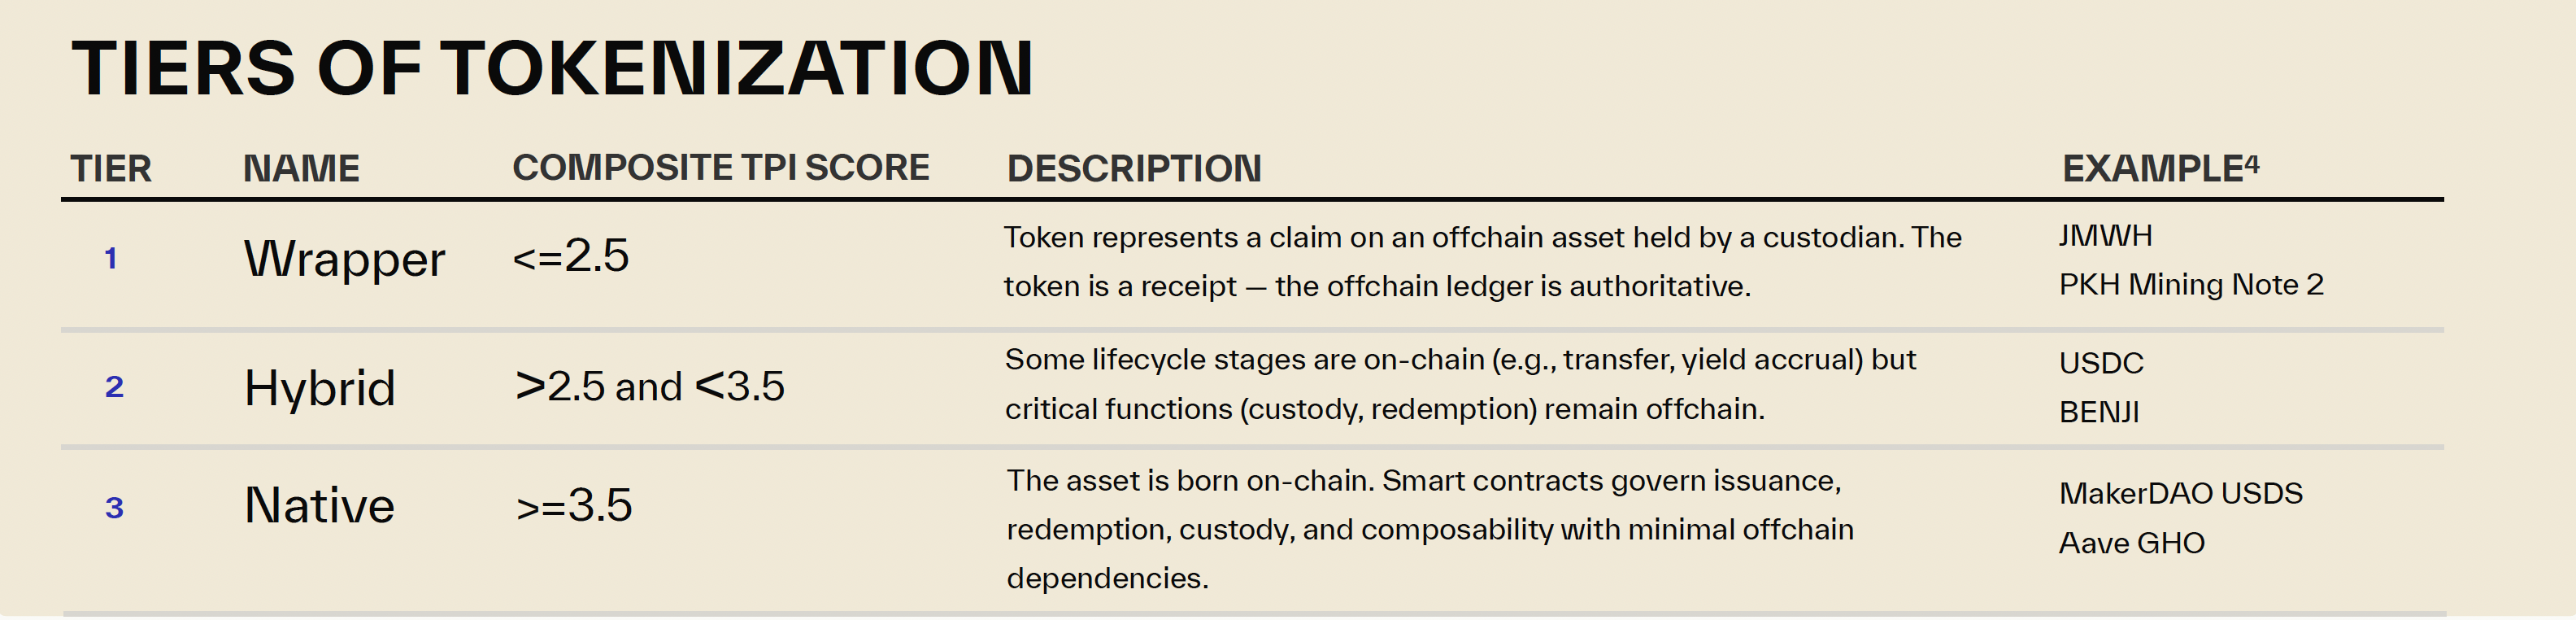
Table 4. Three Tiers of Tokenization
These thresholds are not meant to imply that maturity advances in perfectly even steps. Rather, they provide a practical way to summarize how much of an asset’s lifecycle has actually moved on-chain.
- Wrapper: the token mainly functions as a digital receipt for an underlying asset that is still custodied, redeemed, and administered off-chain. The chain may improve distribution or visibility, but it is not the authoritative operating layer.
- Hybrid: some parts of the lifecycle have moved on-chain, such as issuance, transfer, settlement, or limited composability, but critical functions still depend on off-chain intermediaries, legal processes, or manual controls.
- Native: the asset is designed to operate primarily on-chain. Issuance, transfer, settlement, and at least part of the asset’s ongoing administration are governed by smart contracts, with minimal reliance on off-chain operational infrastructure.
This tiering framework should be read as an interpretive layer on top of the TPI, not as a substitute for the underlying dimension scores. Two assets can sit in the same tier for different reasons: one may be strong on transferability but weak on redemption, while another may be highly composable but still operationally constrained elsewhere. The tier labels help summarize where the market is; the dimension scores explain why.
5. The Data
The following analysis covers 542 scored assets out of 593 total (51 recently added assets are pending scoring since they are Pilot and Announcement and not live yet.).
Asset-level data was compiled from RWA.xyz, DeFiLlama, protocol documentation, and publicly available news and research sources. TVL and AUM figures are sourced from RWA.xyz and DeFiLlama as of Q1 2026. Network deployment data is based on contract verification across Etherscan, Solscan, Polygonscan, and Basescan. By aggregating these sources, we consolidated a range of market-value metrics, including bridged token market cap, AUM, and on-chain or active market cap, into a unified market-value layer. We then joined this market layer with a broader body of LLM-assisted launch, sponsor, platform, jurisdiction, and news metadata, which was reviewed and standardized into the asset-level database.
We also snapshot the “DeFi Active TVL” metric from DeFiLlama as our measure of on-chain productive TVL for the discussion in the DeFi composability section, inspired by work from Nexus Data Labs.
Standardizing asset-class taxonomy is one of the more difficult parts of building this dataset. By reconciling classifications across multiple sources, we consolidate the market into the following 11 asset classes:
- Stablecoins: Tokenized fiat-linked monetary assets, including issuer-backed stablecoins, protocol-issued stablecoins, synthetic dollars, and yield-bearing stablecoin structures.
- US Treasury Debt (Treasury): Tokenized exposure to U.S. Treasuries, Treasury bills, Treasury-backed money market funds, and related government securities products.
- non-US Government Debt: Tokenized sovereign or quasi-sovereign debt outside the U.S., including gilts, digital sovereign bonds, and non-U.S. government money market instruments.
- Tokenized Stocks: Tokenized exposure to public equities, ETFs, equity indices, and other stock-linked instruments.
- Private Credit: Tokenized exposure to privately originated credit, specialty finance, including direct lending, invoice factoring, trade finance, industrial finance, receivables, asset-backed credit, and diversified lending strategies.
- Private Equity: Tokenized equity interests in private companies, venture funds, secondaries funds, and other private-market ownership vehicles.
- Commodities: Tokenized exposure to physical commodities or commodity-linked products, including metals, energy, carbon credits, and commodity ETFs.
- Corporate Bonds (Corp. Bonds): Tokenized corporate debt instruments and related credit products, including digital bonds, structured notes, warrants, and corporate bond ETFs.
- Actively-Managed Strategies (Active Strategies): Tokenized fund or vault structures where returns depend on an actively managed strategy rather than a single static asset.
- Real Estate: Tokenized ownership or economic exposure to real estate assets, property SPVs, rental portfolios, and fractional property products.
- RWA Infrastructure (RWA Infra): Platforms, issuance rails, settlement systems, interoperability layers, compliance layers, and other infrastructure that enables tokenized assets rather than representing the end-asset itself.
5.1 The Market Is in the Wrapping Phase, with Transition to Hybrid
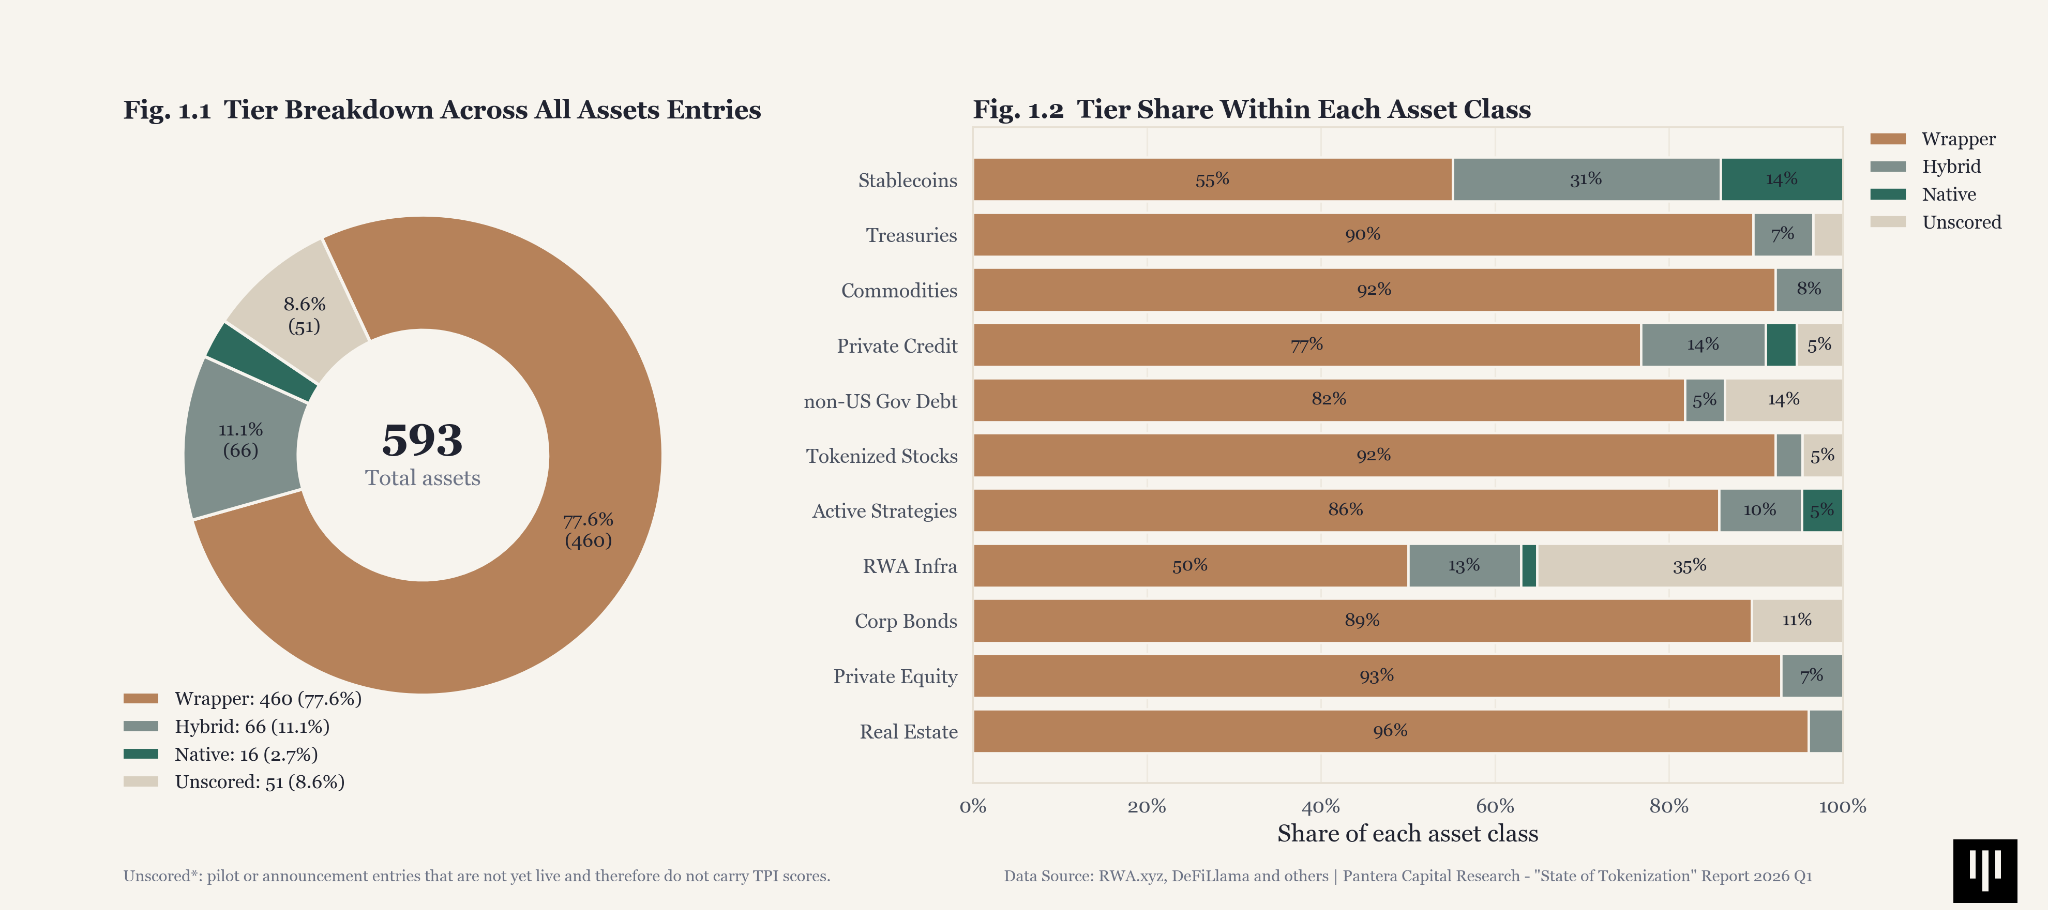
Fig. 1. Overall TPI Tier share (by asset count) across asset class
Roughly 77.6% of all tracked assets fall into the Wrapper bucket, while only 11.1% qualify as hybrid and just 2.7% reach the native tier. In other words, tokenization has achieved scale in representation, but not yet in full on-chain functionality. The center of gravity remains off-chain, even as a growing set of assets begins to move meaningfully further along the path.
Stablecoins are the clear outlier and most advanced category, with 14% assets in the category reaching the Native scoring. They contain the deepest hybrid cohort and the largest native share, followed by Active Strategies and Private Credit.
Treasuries and Commodities, Private Equity show early movement toward more hybrid structures, but still lean heavily wrapper overall.
RWA Infra is treated as a separate special category. It is not strictly an asset class with comparable market value in the same way as the other categories, but we still score these entries using the TPI based on the available information. It also contains most of the upcoming pilot programs and announcements, suggesting that a significant amount of infrastructure and legal groundwork is still being built around the RWA ecosystem.
Below, we summarize the 51 unscored assets in the dataset, which are primarily pilot programs and announcement-stage RWA launches. Most are concentrated in the RWA Infrastructure category, with a diverse geographic distribution across jurisdictions.
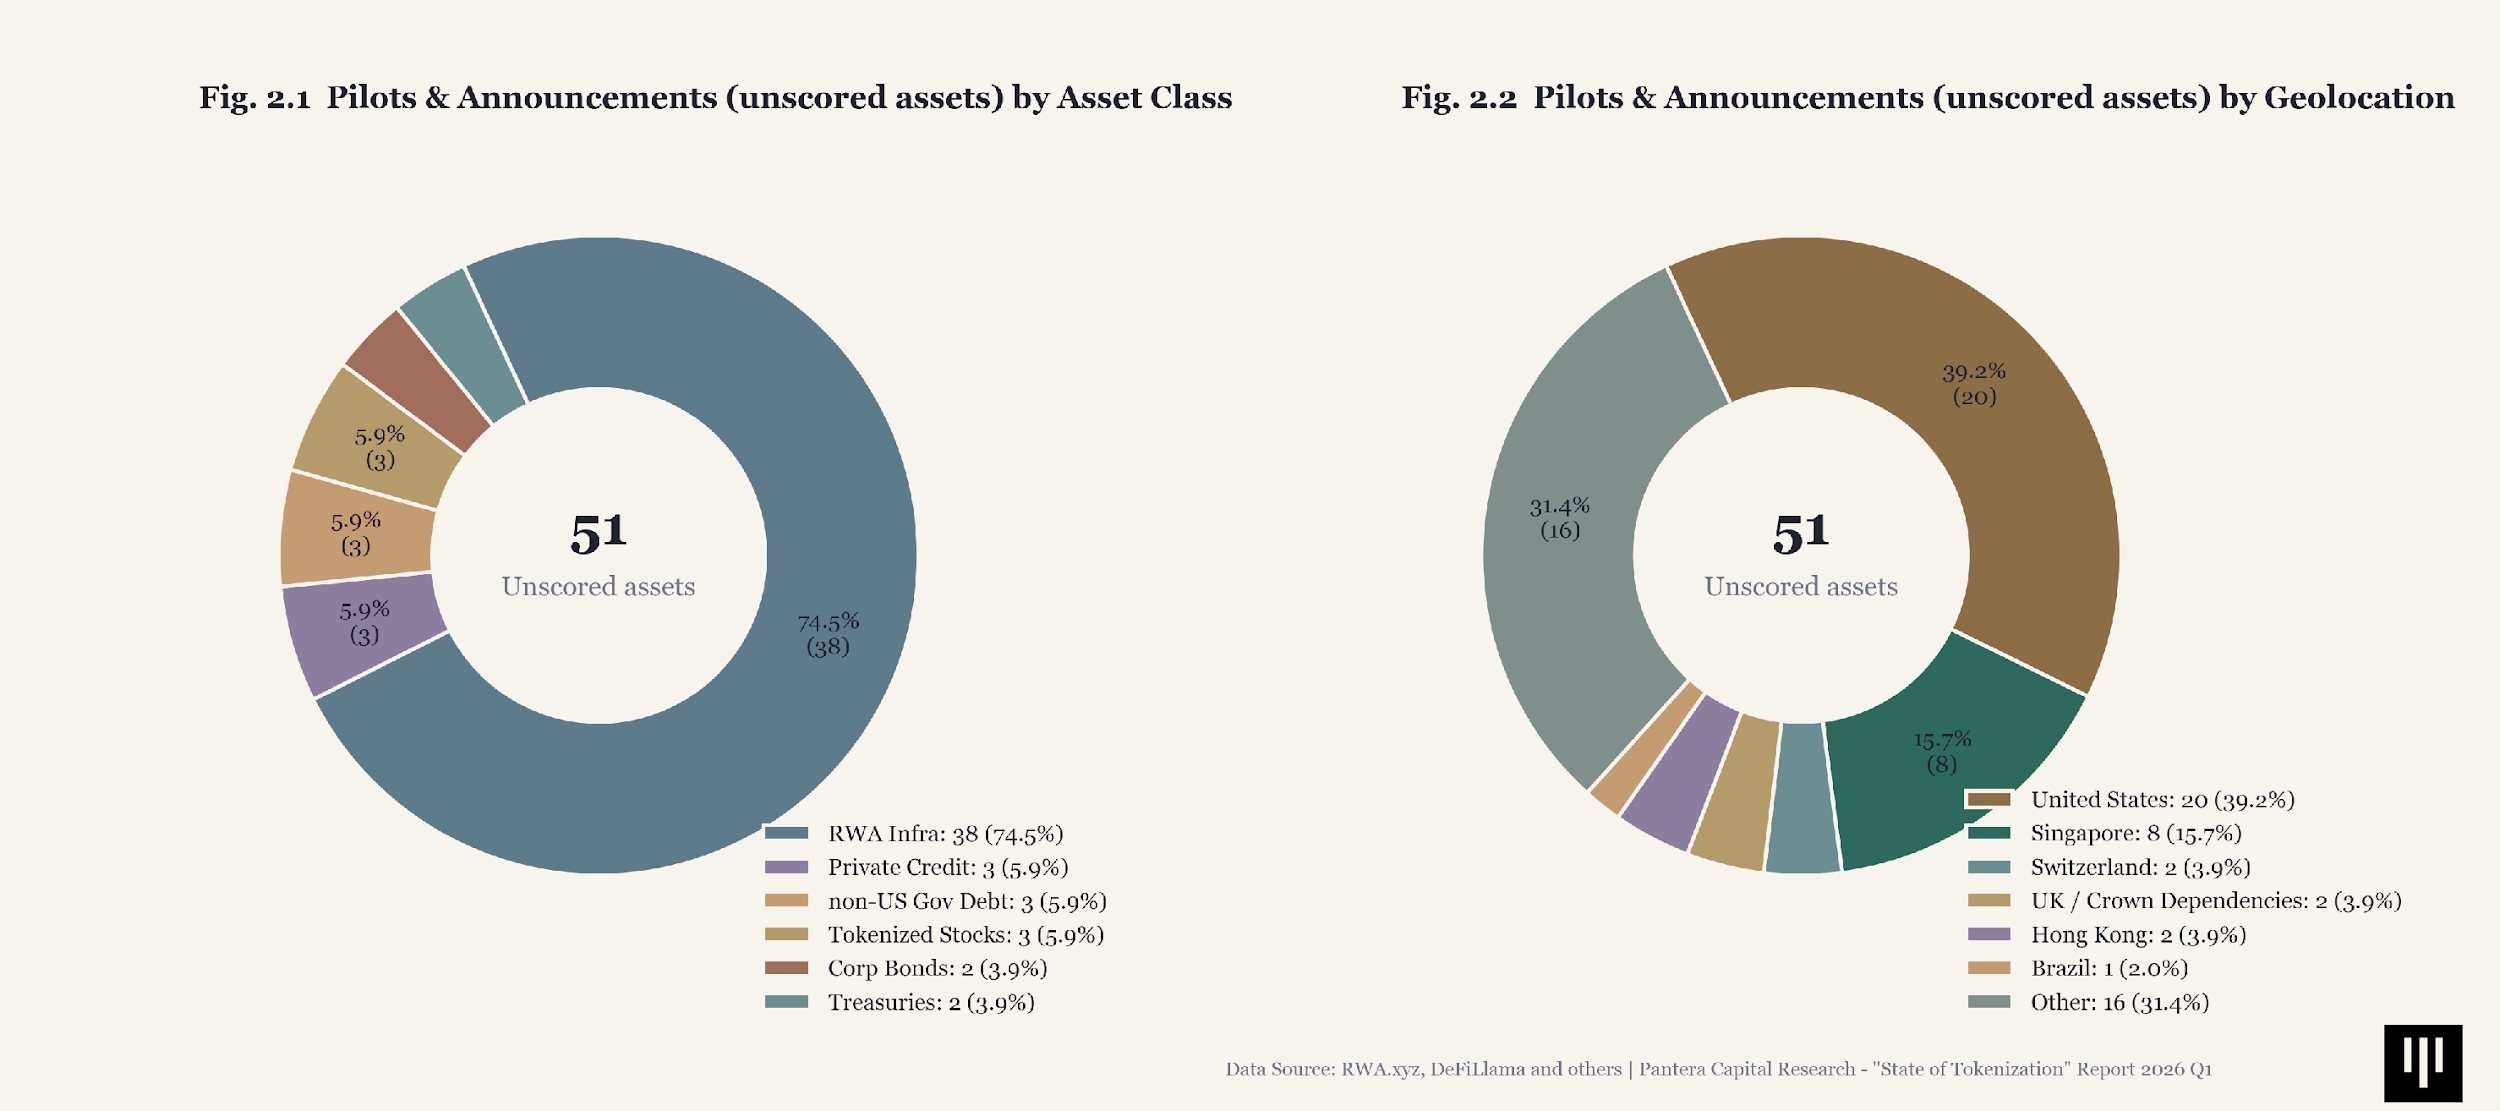
Fig. 2. Asset class and Geolocation breakdown for upcoming RWA pilots
5.2 Asset Launches and Market Size Hit New High in 2025
168 new tokenized assets launched in 2025, a 115% increase over 2024’s 78 launches. The 2023-2025 acceleration reflects institutional FOMO — every major player rushing to have a tokenization offering. But the composite TPI has not risen proportionally. The market is getting wider, not deeper. New entrants are largely replicating the Tier 1 wrapper pattern rather than pushing the frontier of what tokenized assets can do.
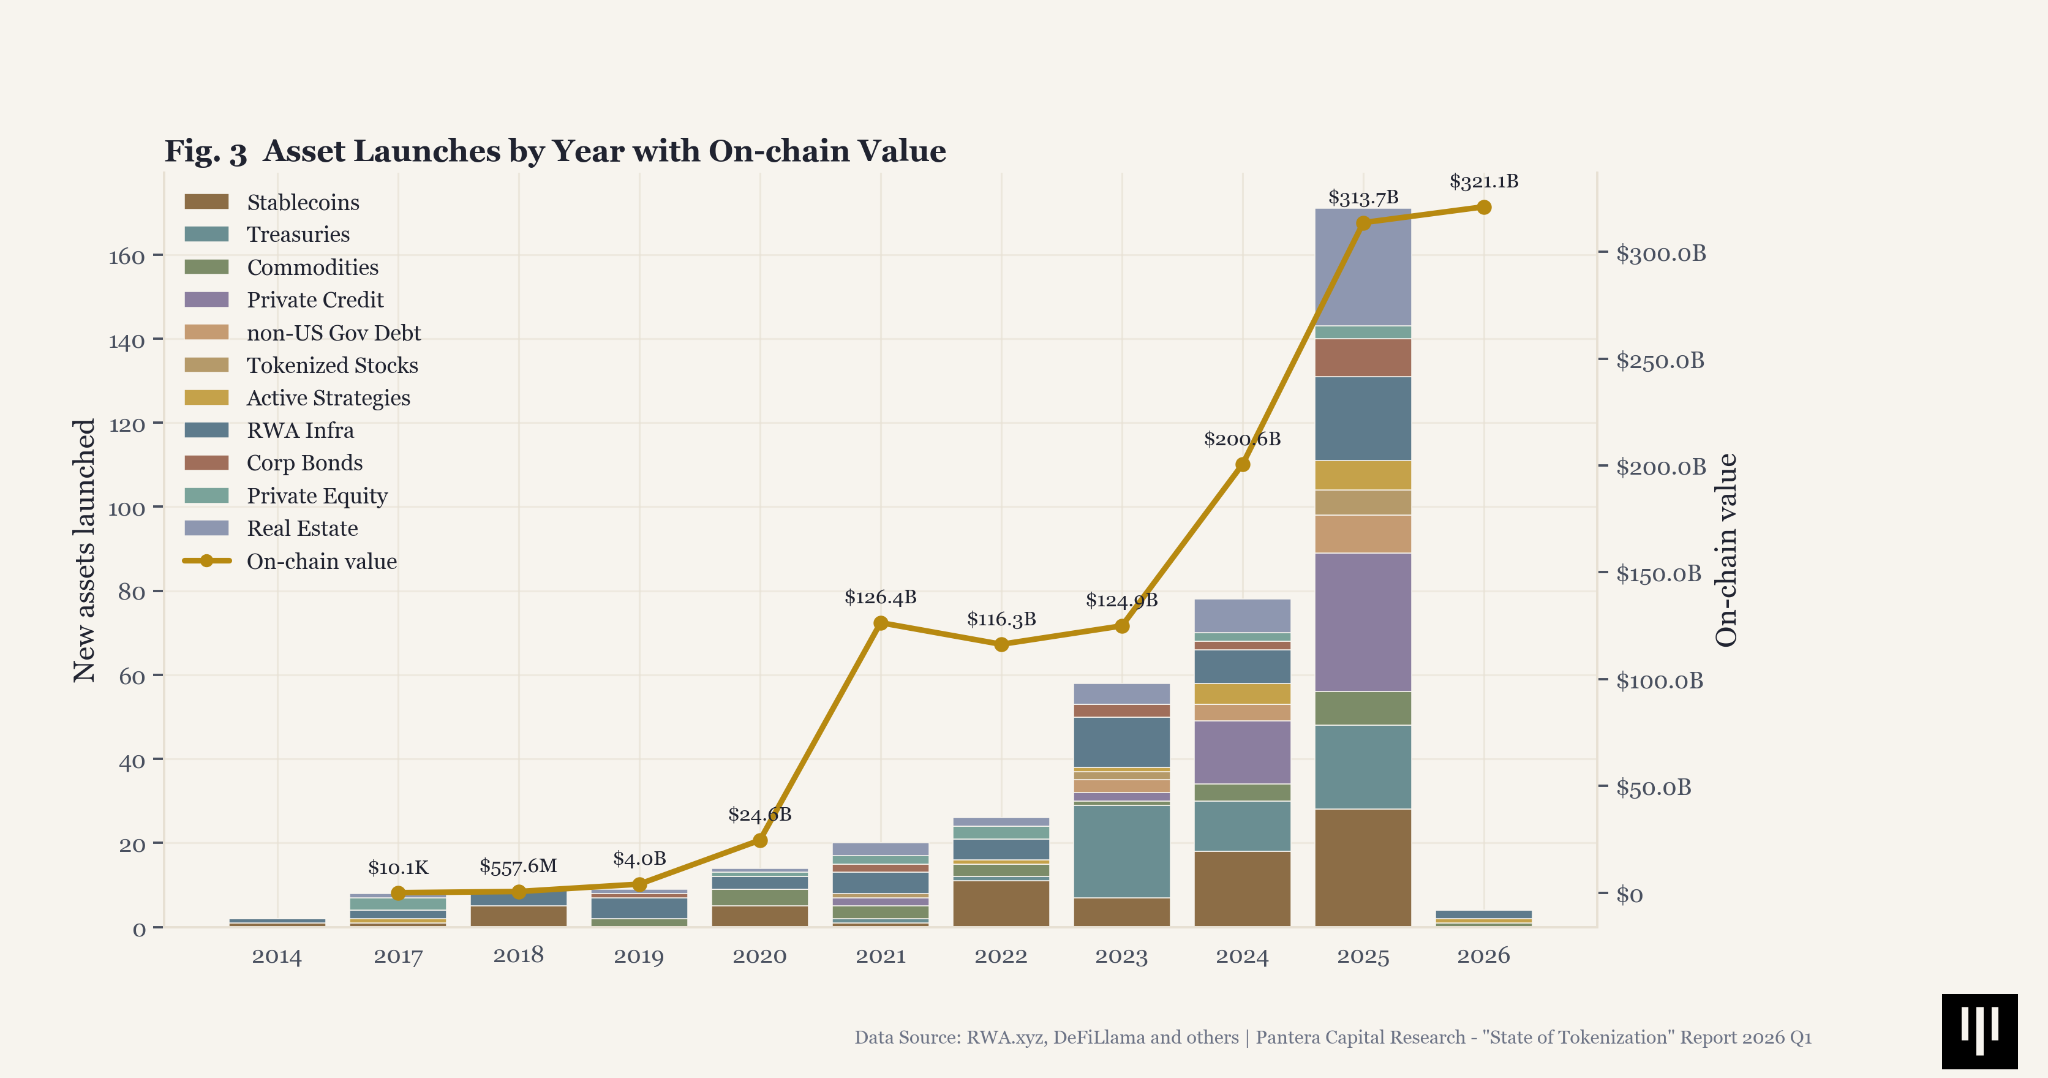
Fig. 3. Asset launches by year with total market value
A clean read from Fig. 3 data is that issuance has been concentrated in a few categories rather than evenly distributed across the market. Over the last two full launch years in the dataset, 2024 and 2025, Private Credit led all asset classes with 48 launches, just ahead of Stablecoins at 46, followed by Real Estate at 36 and US Treasury Debt at 32.
On the value side, the market has continued to scale rapidly even as launches diversified: total tracked value rose from about $200.6B in 2024 to $313.7B in 2025, and now sits at roughly $321.1B in the latest 2026 snapshot. That means the market has added about $120.5B since 2024, or roughly 60% growth, reinforcing the idea that tokenization is not just broadening in asset count but also compounding meaningfully in aggregate value.
5.3 Stablecoins Hold $293B — 91.6% of Total Market Value
Stablecoins dominate tokenized asset value by an order of magnitude, representing over $293B of the total accountable market size of $319.9B (~91.6%). US Treasuries have grown to approximately $12B, driven by institutional demand for on-chain yield.
Commodities have also surged to roughly $7.1B, but the category’s rise partly reflects the 2025 gold rally itself: existing tokenized gold products gained value as the underlying asset appreciated, rather than growth coming solely from new assets moving on-chain.
But the long tail of asset classes — private equity, real estate, corporate bonds — remains small by AUM. The market’s value is concentrated in the asset classes that reached on-chain maturity earliest, not in the asset classes with the most institutional announcements.
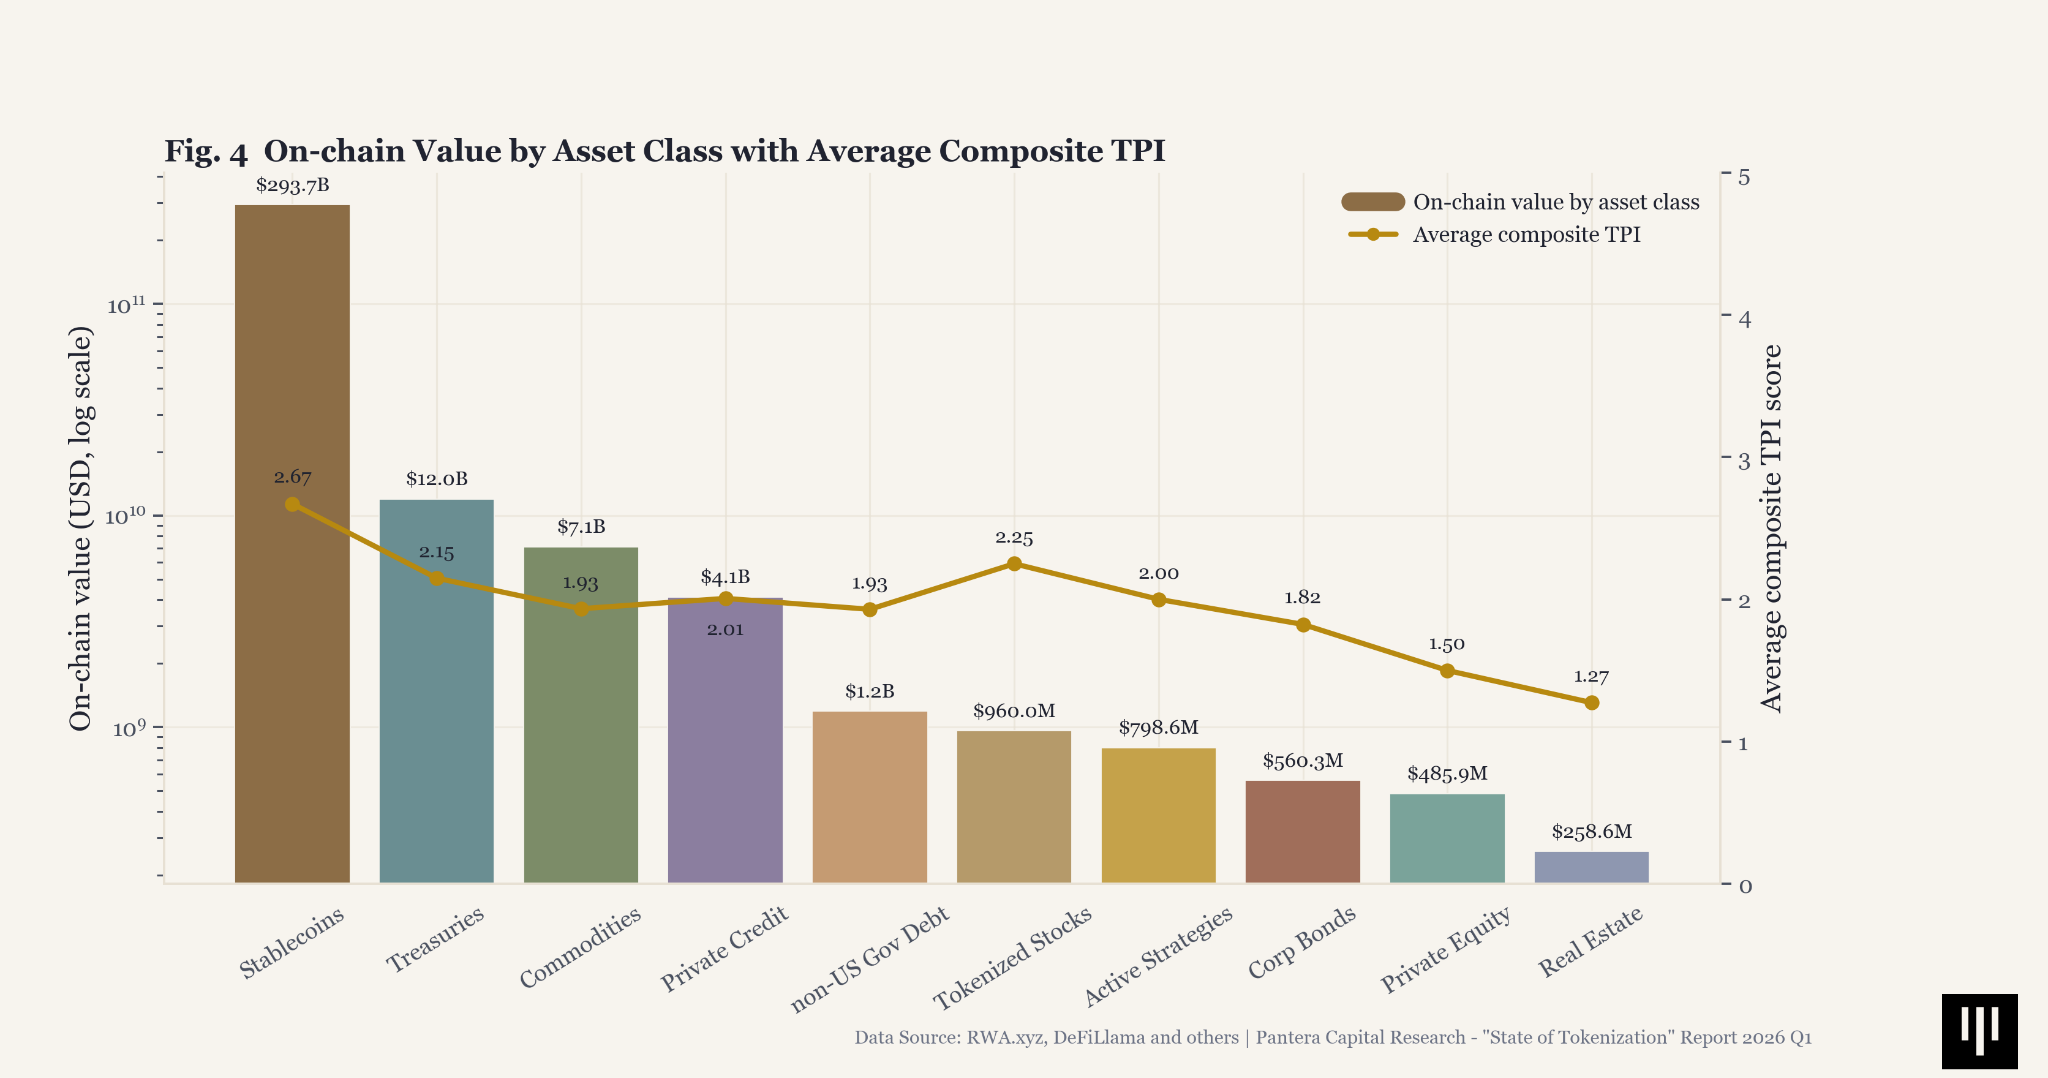
Fig. 4. Total value by asset class on a log scale
5.4 Institutions Drove Treasuries to $12B, Making It the 2nd Biggest Asset On-Chain
Tokenized US Treasuries Debt (annotated and referred as “Treasuries” in this report) represent the most visible success story in institutional tokenization — from near-zero in 2021 to approximately $12B in 2026. The growth has been exponential and likely reinforced by the fact that DeFi yields have remained compressed in recent months, in some cases below U.S. Treasury yields, making tokenized Treasuries a more attractive on-chain parking place for capital. Despite the explosive growth, the TPI analysis indicates that most Treasury products remain in early stage as Tier 1 wrappers with custodian-mediated redemption and offchain-primary ledger architectures.
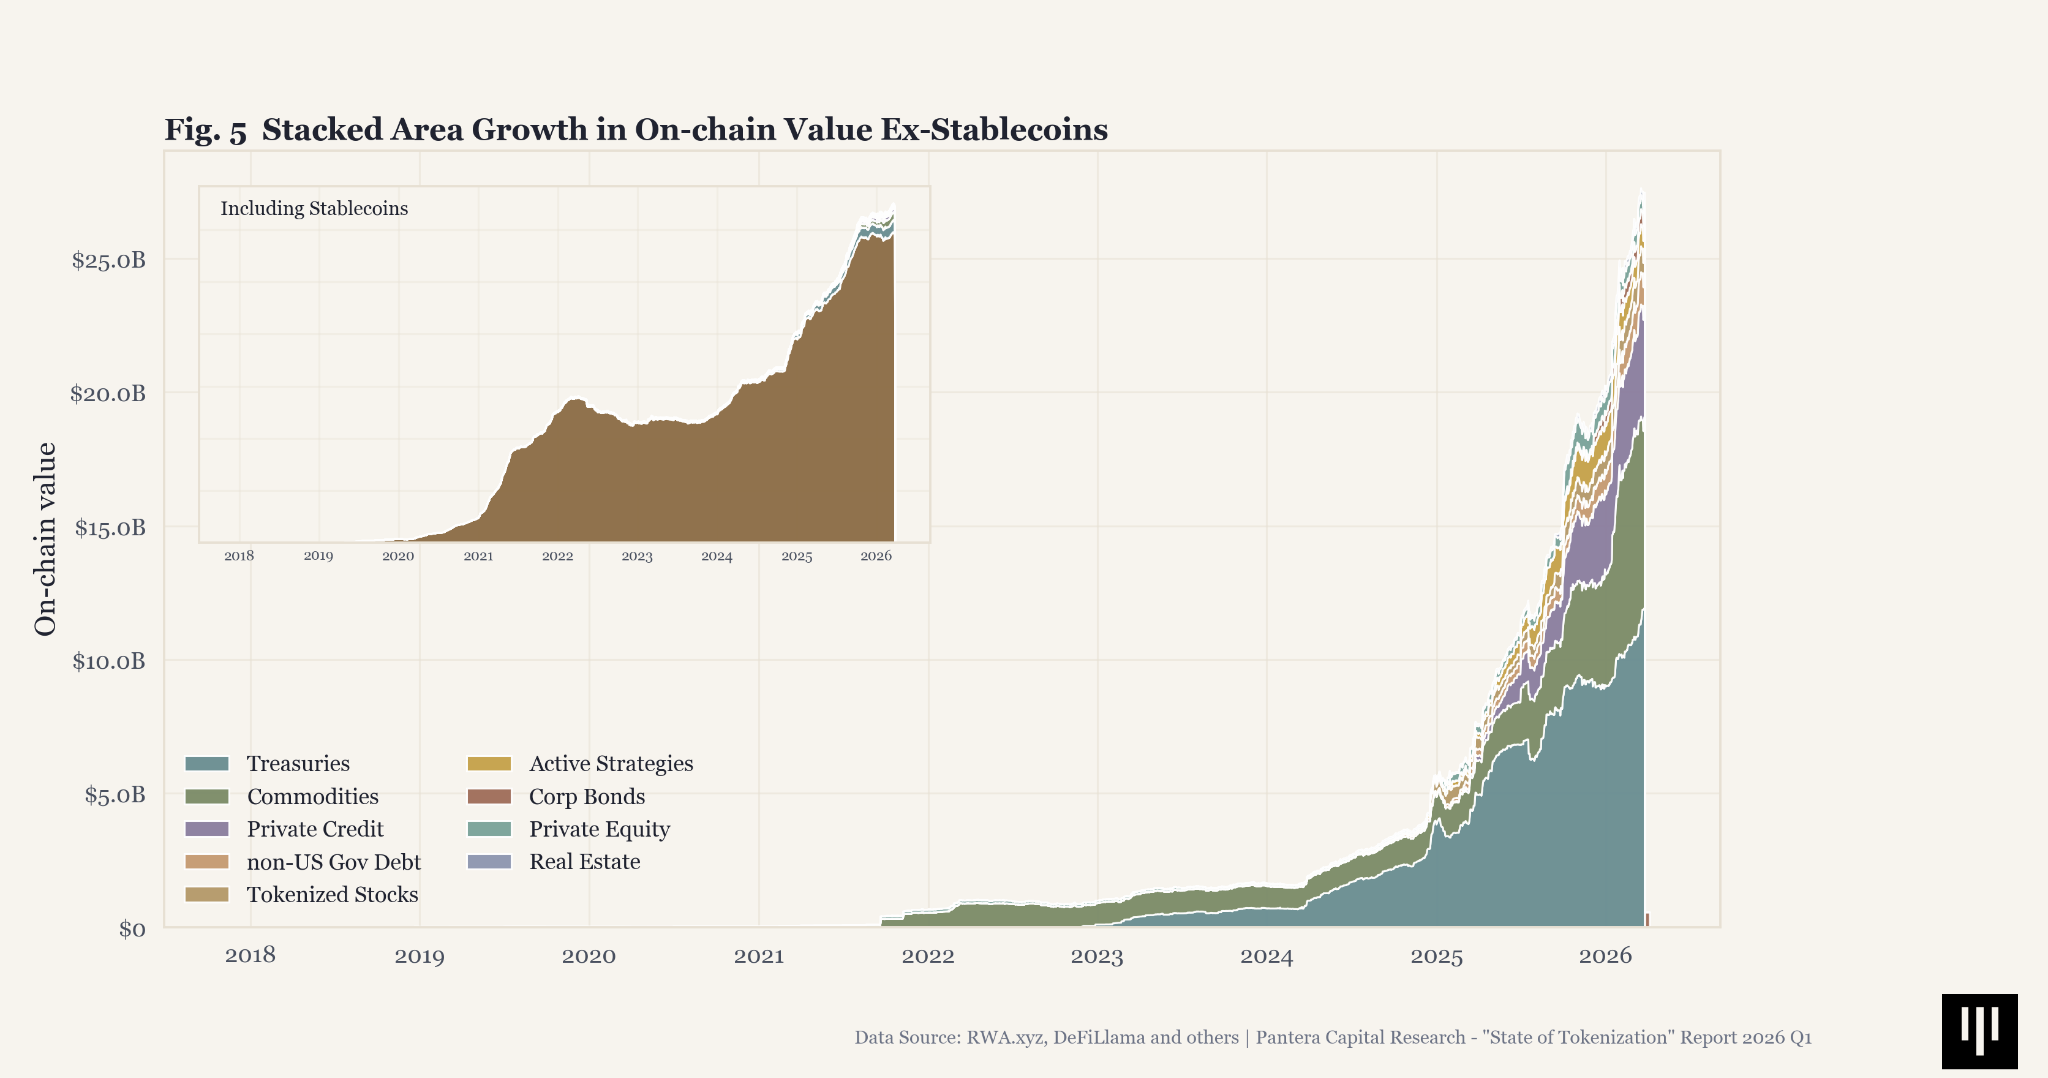
Fig. 5. Tokenization market growth by on-chain value
That growth is increasingly anchored by large, recognizable institutions rather than by long-tail experimentation. In our dataset, the biggest tokenized Treasury products come from names such as BlackRock (BUIDL, ~$2.1B, issued via Securitize), Franklin Templeton (FOBXX / BENJI, ~$1.0B, issued through Franklin Templeton Benji Investments), Janus Henderson / Anemoy (~$1.0B, issued via Centrifuge), WisdomTree (WTGXX, ~$752M, issued on its own digital-fund rails), and Fidelity (FDIT, ~$162M, issued through Fidelity Investments). This suggests that tokenized Treasuries have become the clearest institutional beachhead in tokenization: a category where major financial firms are comfortable bringing familiar short-duration dollar products on-chain, even before deeper native functionality has fully emerged.
The institutional footprint is also starting to extend beyond Treasuries. In Private Credit, Apollo appears in the dataset through the Apollo Diversified Credit Securitize Fund (~$131M), while Janus Henderson / Anemoy also show up through structured credit products in the Centrifuge ecosystem. In Stablecoins, Société Générale-FORGE’s EURCV is an early example of a major bank-originated tokenized cash product. The broader pattern is that large institutions are not entering tokenization first through fully native on-chain financial structures; they are entering through familiar products and relying on specialist issuance partners such as Securitize, Centrifuge, and Libeara to bring those products on-chain.
5.5 Growth Diverges: Some Asset Classes Saturated While Others Just Emerged
The category-level growth curves show that tokenization is not a straight-line adoption story, but a cyclical one. RWA markets have existed in some form for years, but the 2022 drawdown makes clear that they were not insulated from the broader crypto contraction. What is notable in the current cycle is how quickly momentum returned afterward: since that trough, aggregate value has resumed climbing across most major asset classes, suggesting that tokenization is moving from episodic experimentation toward a more durable market structure.
Stablecoins and Active Strategies were among the earliest and fastest-growing segments in this rebound, though their trajectories now appear to be moderating after a particularly strong prior year. By contrast, Private Equity and Commodities stand out as two of the strongest growth categories over the last two years, with neither yet showing an obvious loss of momentum.
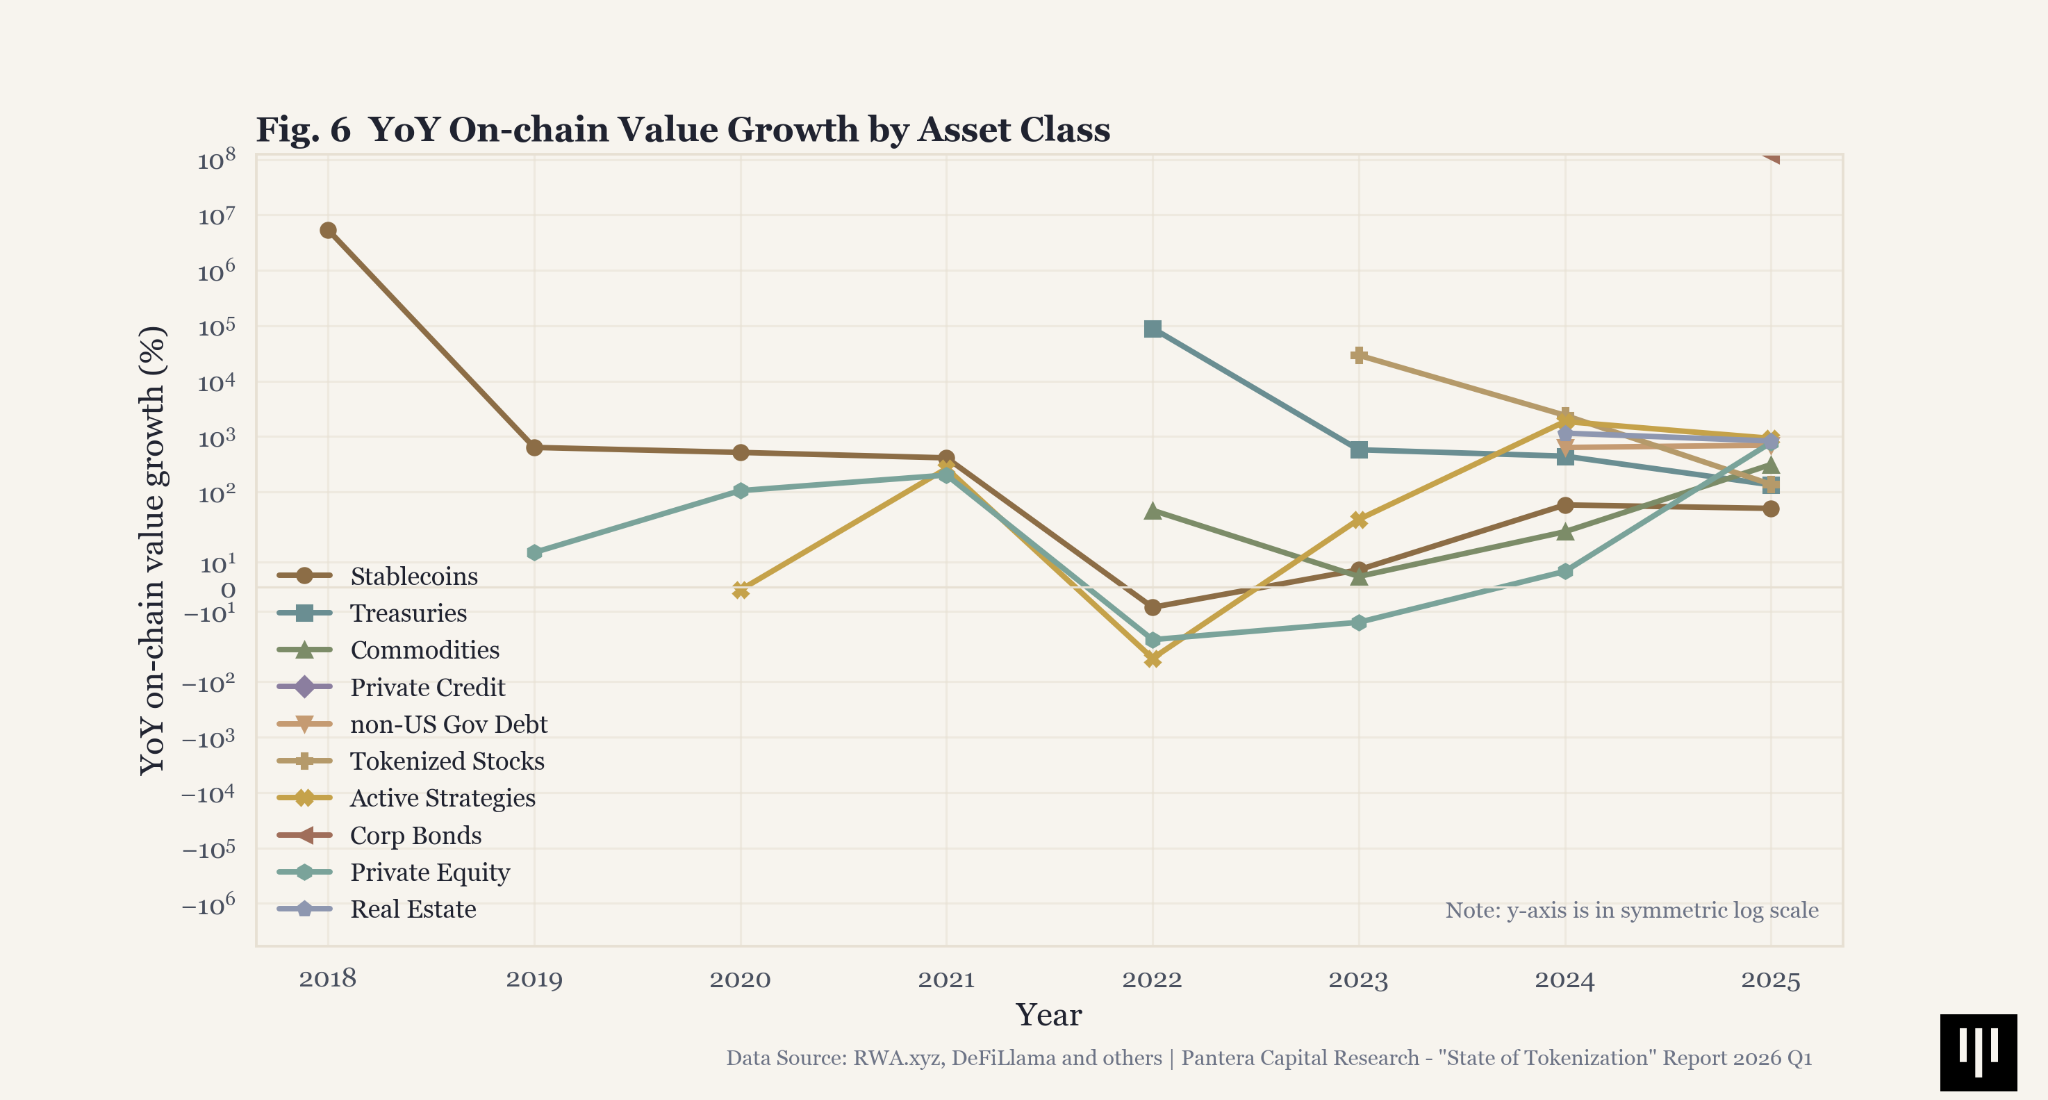
Fig. 6. Category YoY growth rates by on-chain value
US Treasuries and Tokenized Stocks are both more recent developments after 2022, but their curves now look flatter relative to the initial breakout, which may indicate the category saturated quickly.
Real Estate and non-US Government Debt, by contrast, still look earlier in their adoption cycle: their growth histories are shorter, making it too soon to call a durable trend, but both remain promising areas where the value base is still forming.
Corporate Bonds, standing alone as a simple datapoint on the top of the chart appearing in 2025, is the most nascent yet with biggest hype based on the growth. The series is barely visible today because it has only recently appeared in the data, but the direction of travel is encouraging and, from such a small base, potentially one of the more bullish emerging segments to watch.
5.6 Market Size and TPI Score Begin to Move Together
The scatter plot below maps each asset class by its average TPI composite (x-axis) against its total value locked (y-axis, log scale). The latest market structure suggests that market size and tokenization progress are no longer moving independently. At the asset-class level, there is now a visible positive relationship: the categories with the largest market value also tend to score somewhat higher on average TPI. Stablecoins sit furthest along both dimensions, while Treasuries also pair large-scale with a relatively stronger tokenization progress profile than most non-stablecoin categories.
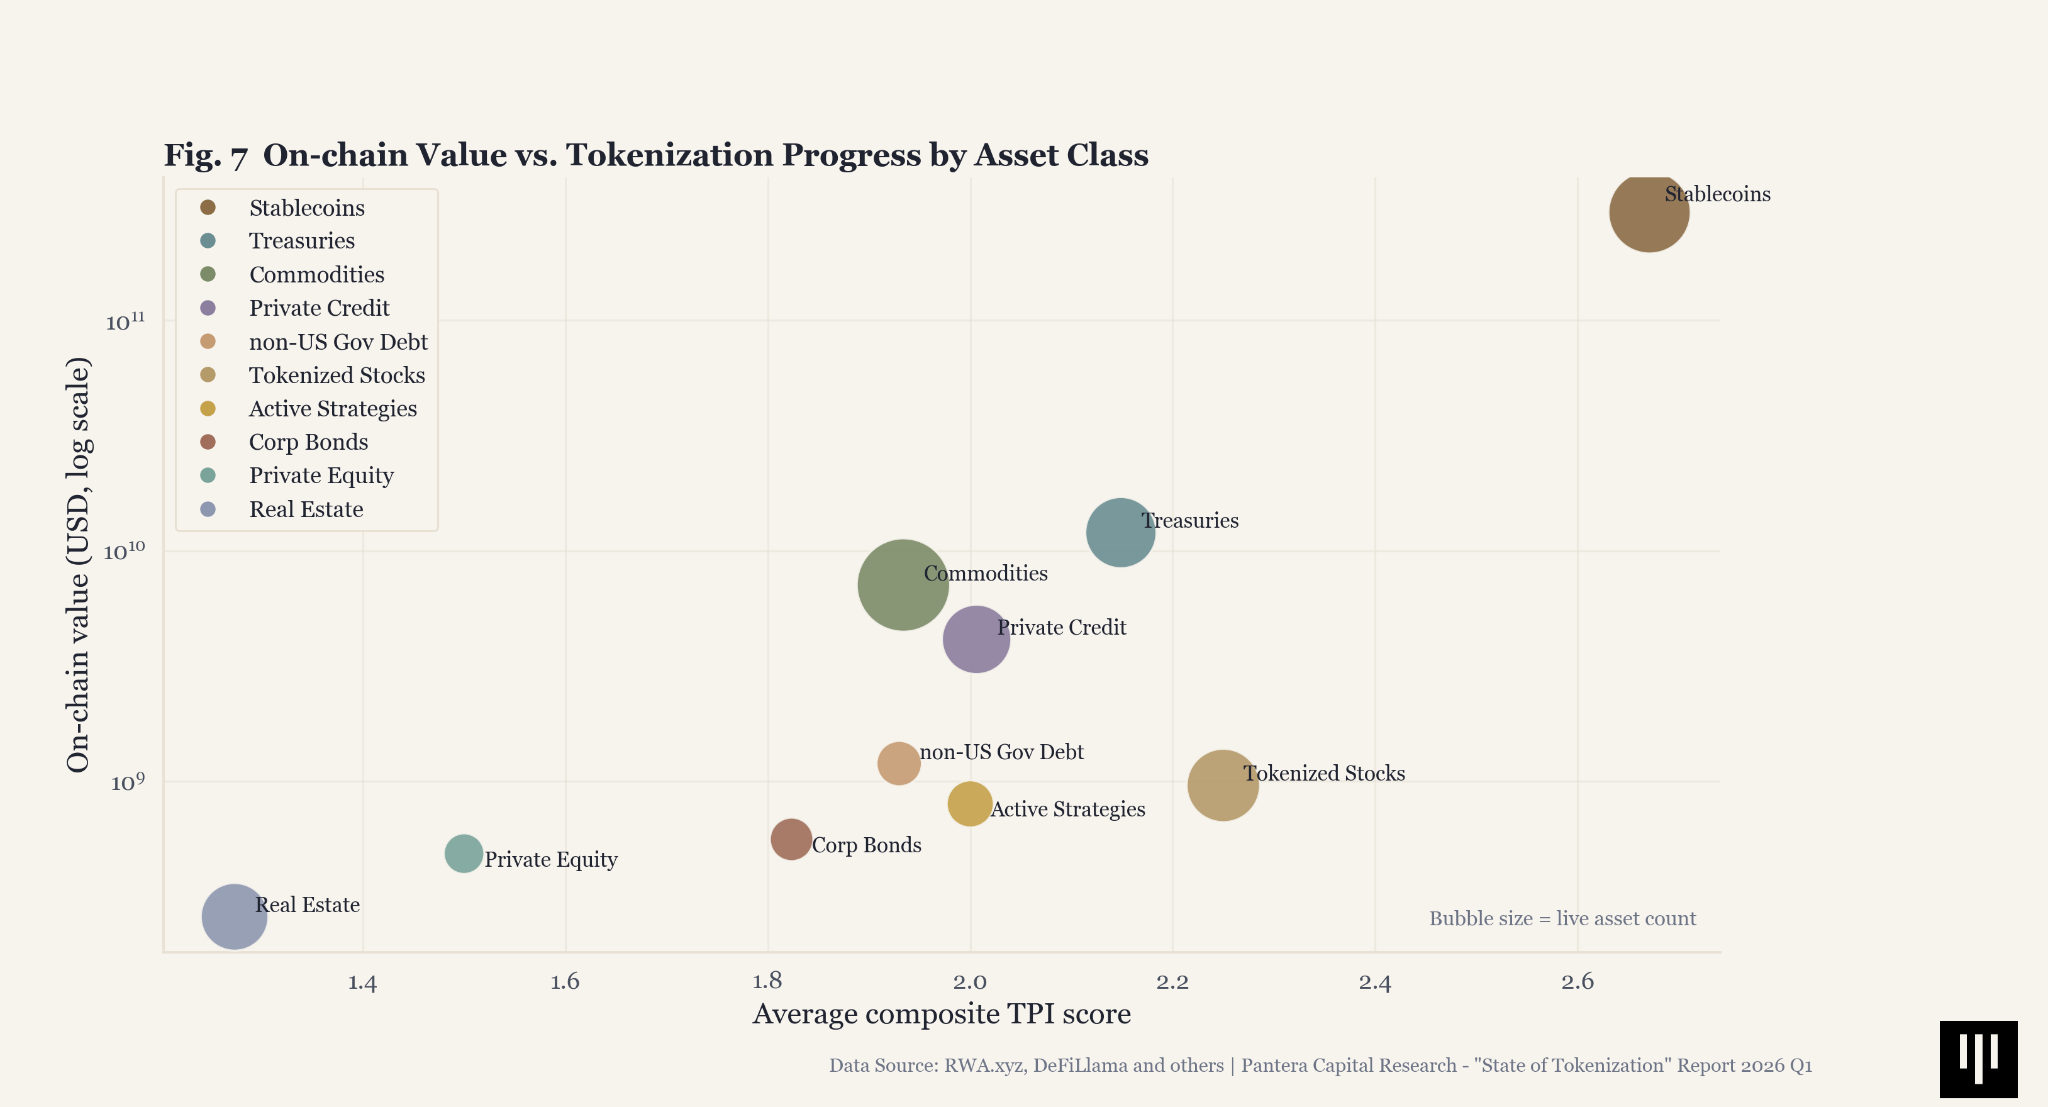
Fig. 7. On-chain value vs. tokenization progress by asset class
At the other end of the spectrum, Real Estate and Private Equity remain low on both value and tokenization progress, reinforcing how dependent they still are on off-chain legal, custody, and servicing workflows. That said, the relationship is still only directional, not linear. Categories such as Commodities and Private Credit have accumulated meaningful value without a corresponding jump into truly high TPI territory. In other words, capital is beginning to favor structurally stronger designs, but scale still arrives faster than full on-chain maturity.
5.7 91% of Tokenized Assets Are Still Gated Issuance & Redemption
Score distributions still show a market concentrated in the lower bands across all three TPI dimensions, with Issuance & Redemption remaining the clearest bottleneck. In the latest dataset, 494 of 542 scored assets, or 91.1%, still score 1 or 2 on issuance, meaning admin-gated minting and custodian-mediated exits remain the norm. Only 13 assets (2.4%) score 4 or 5, which means truly autonomous or symmetric mint/burn models are still rare.
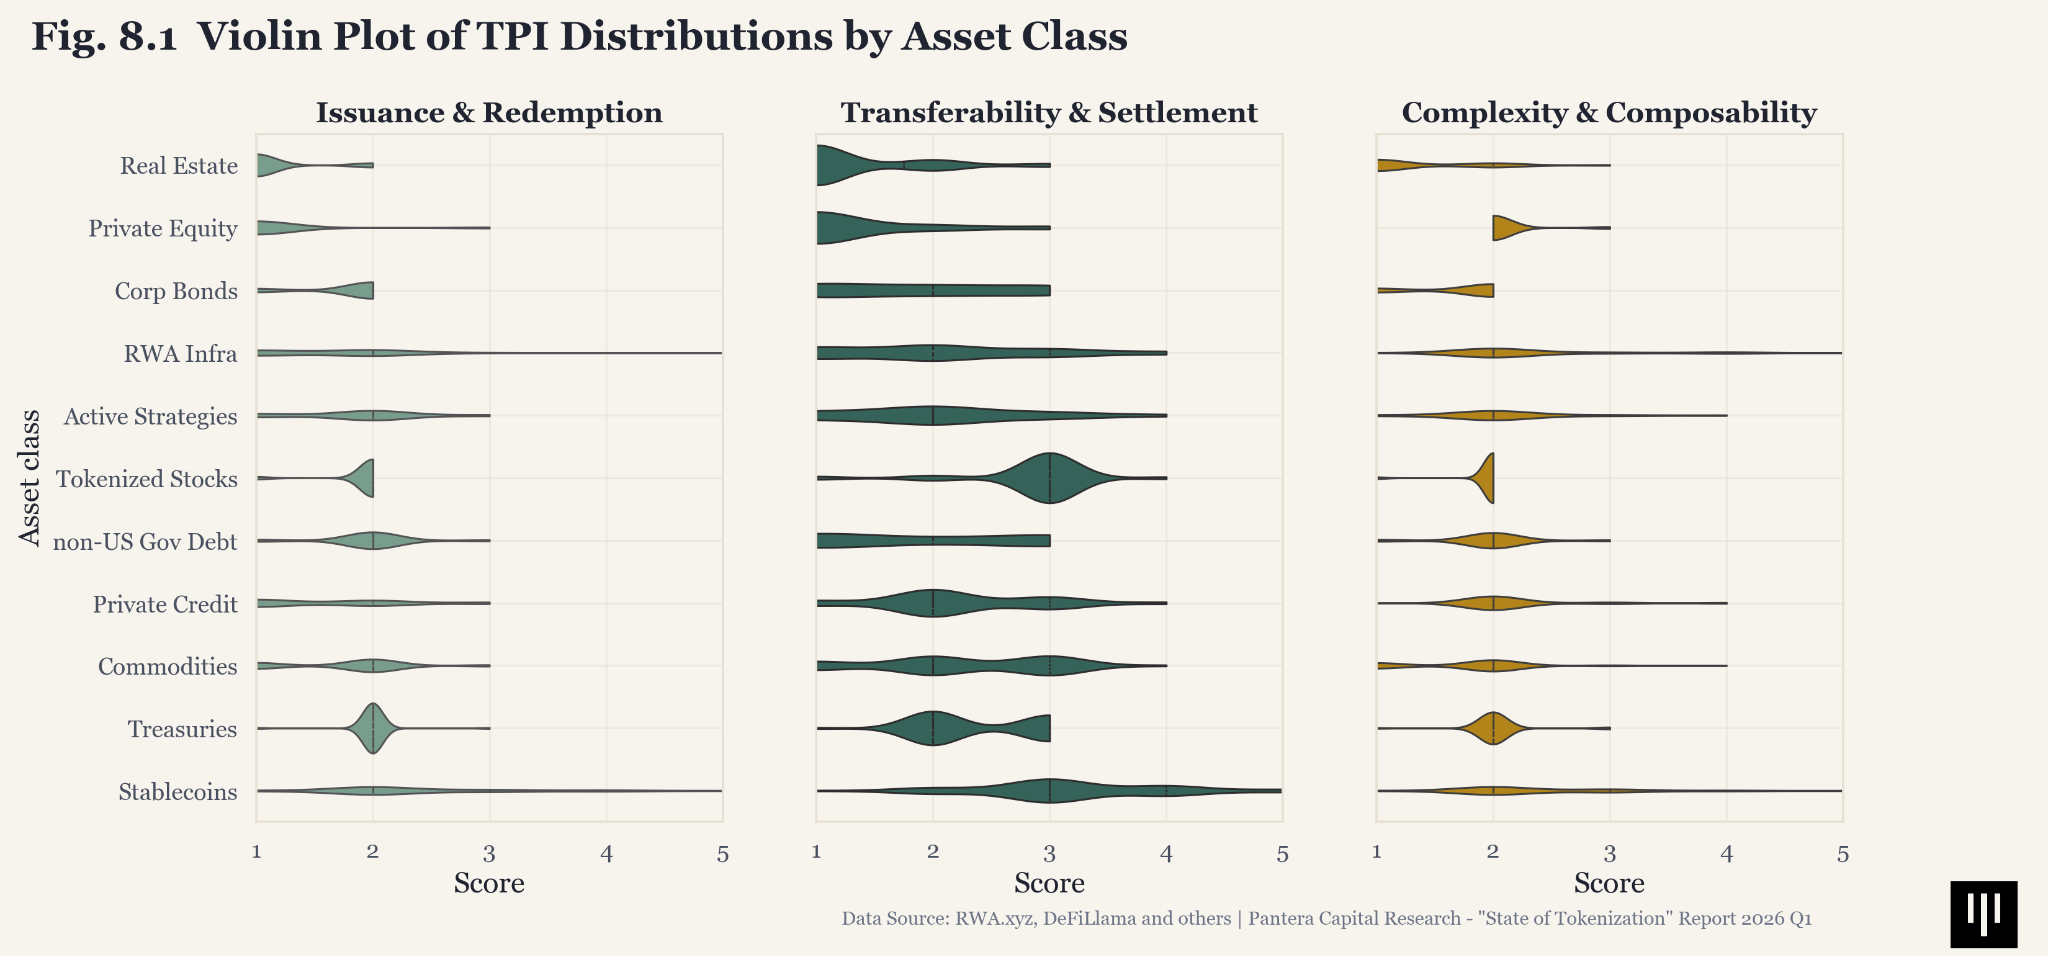
Transferability & Settlement shows more dispersion: 205 assets (37.8%) now reach score 3, suggesting a growing dual-ledger middle where tokens can move on-chain but the chain is not yet the sole authoritative record. Complexity & Composability remains even more compressed. 394 assets (72.7%) still score 2, while only 21 assets (3.9%) reach score 4 or 5, reinforcing that most tokenized products are still simple wrappers rather than deeply programmable on-chain financial primitives. We also attached the full distribution by asset class in the violin chart in Appendix (Fig. 8.1.).
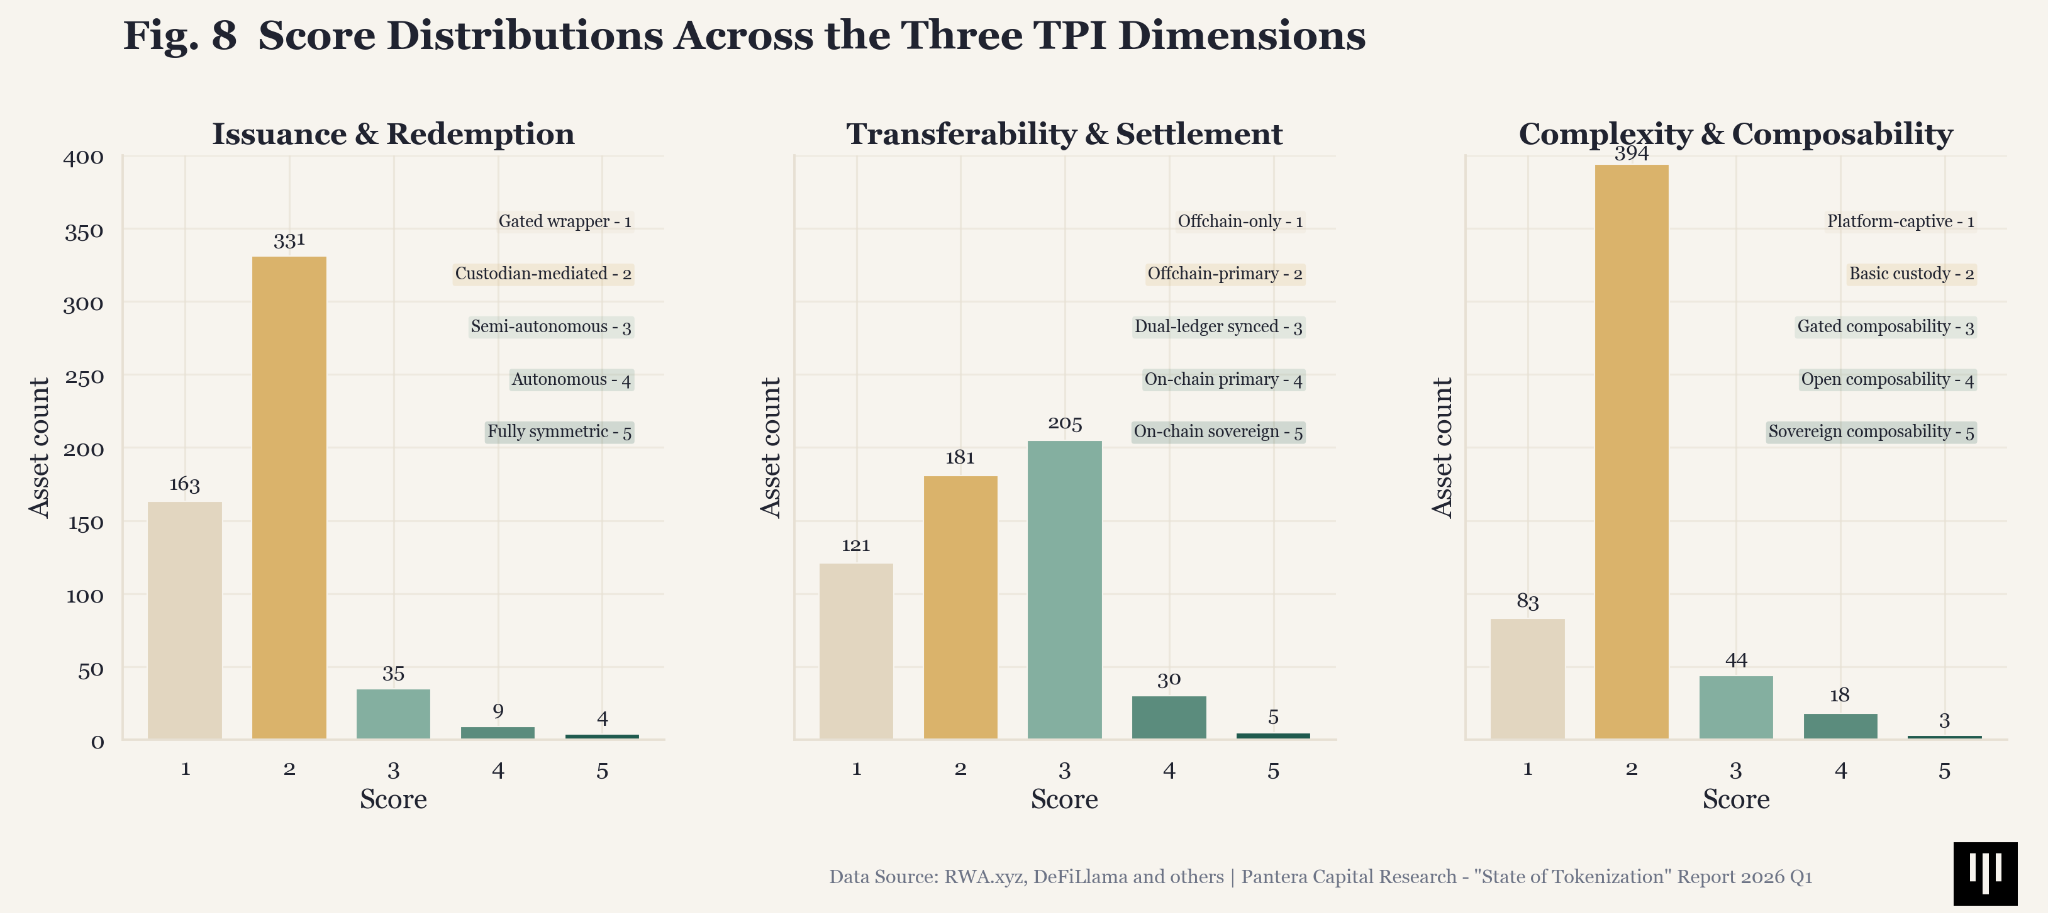
Fig. 8. Score distributions across the three TPI dimensions
5.8 Private Credit Leads DeFi Utilization at 64.3%
When we break TPI scores by asset class, stablecoins lead across all three dimensions — with Transferability & Settlement particularly strong at 3.2, reflecting multi-chain deployment and increasingly on-chain-primary ledger architecture. Tokenized Stocks and Treasuries follow with relatively balanced profiles. In the bottom of the rank, Real Estate and Private Equity lag significantly with composites below 1.5, reflecting their platform-captive, offchain-only architectures.
We also attached the distribution violin chart for each asset class data sample in the Appendix.
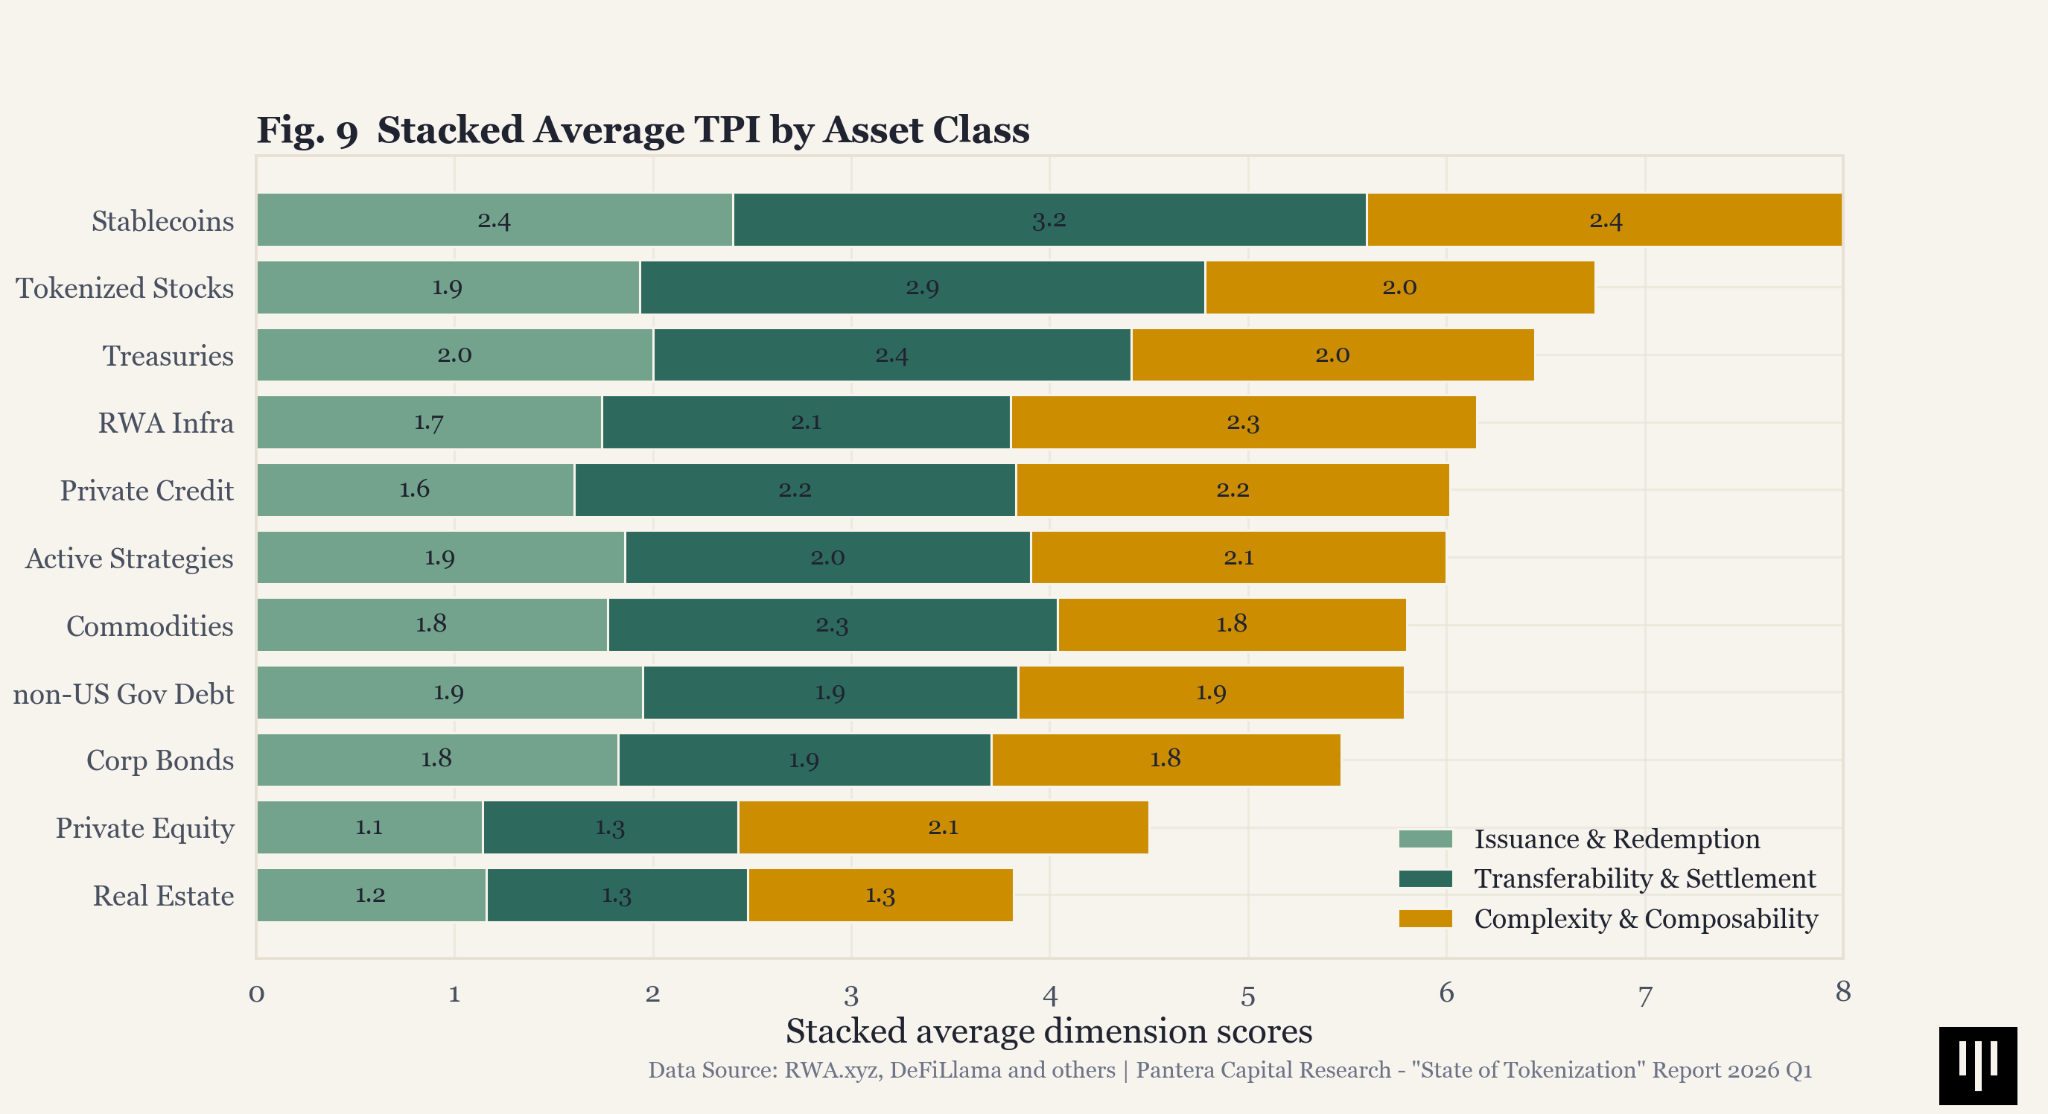
Fig. 9. TPI Breakdown by Asset Class (Stacked by Dimension)
Across all asset classes, only 10.6% reach a Complexity & Composability score of 3 or higher, the threshold we use for meaningful DeFi integration. That confirms that most tokenized assets still exist on-chain primarily as distribution wrappers rather than as productive financial building blocks.
Stablecoins still dominate in absolute terms, with roughly $26.4B currently locked in DeFi, far ahead of every other category. But the more revealing signal is penetration within each category, and the latest data now points somewhere more surprising: Private Credit has become the most DeFi-composed category in the dataset, with 64.3% of total market value showing up as active DeFi TVL, followed by Actively Strategies at 19.0%. Stablecoins, by contrast, rank much lower on this measure at 9.0%, despite their overwhelming absolute scale.
One important nuance is that these two signals are measuring different things. The TPI chart is an asset-level average, while the DeFi utilization rate, by contrast, is measured in dollar terms. As a result, a category such as Private Credit can still show only middling average TPI scores while posting very high DeFi penetration.
One reason is concentration. In Private Credit, DeFi usage is primarily attributed to a small number of protocols and products. For example, Maple’s syrupUSDT and syrupUSDC together account for roughly two-thirds of the category’s active DeFi TVL. In other words, private-credit composability is real, but the asset category is not broadly integrated on-chain yet.
But the other main reason appears to be the nature of the assets themselves. These successful Private Credit products are yield-bearing instruments that accept stablecoins as collateral and fit naturally into DeFi yield strategies, especially where users can loop them through multiple layers of DeFi vaults to increase leverage and compound returns. In that sense, Private Credit utilization is not only a story of issuer concentration; it also suggests that more native on-chain architecture can increase utility. These assets provide a form of yield that is relatively distinct from core crypto beta, which makes them especially useful in on-chain portfolio construction.
Actively Strategies shows a similar pattern. The category ranks second on DeFi composability, but that usage is highly concentrated in a small number of products. Superstate Crypto Carry Fund alone accounts for roughly 80% of the category’s matched active DeFi TVL, with most of the remainder coming from a limited set of additional products, including Re Protocol reUSDe, Midas mBASIS, and Resolv Liquidity Provider Token.
By contrast, much larger categories such as US Treasury Debt and Commodities still have only 3.2% and 2.5% of category value utilized in DeFi respectively, while Real Estate and Corporate Bonds remain effectively at zero.
Stablecoins are still the most important DeFi building block in absolute value, but most stablecoin supply remains outside productive DeFi, held instead as cash-like inventory for payments, trading, treasury management, and settlement.In other words, the DeFi utilization rate is lower for stablecoins not because they are less established as DeFi collateral, but rather because the nature of their utility pushes them into circulation instead of locking them in vaults as investment assets. Meanwhile, Private Credit and yield-oriented Actively Strategies show the attributes of investment vehicles and are increasingly gaining adoption as accepted collateral put to work on-chain.
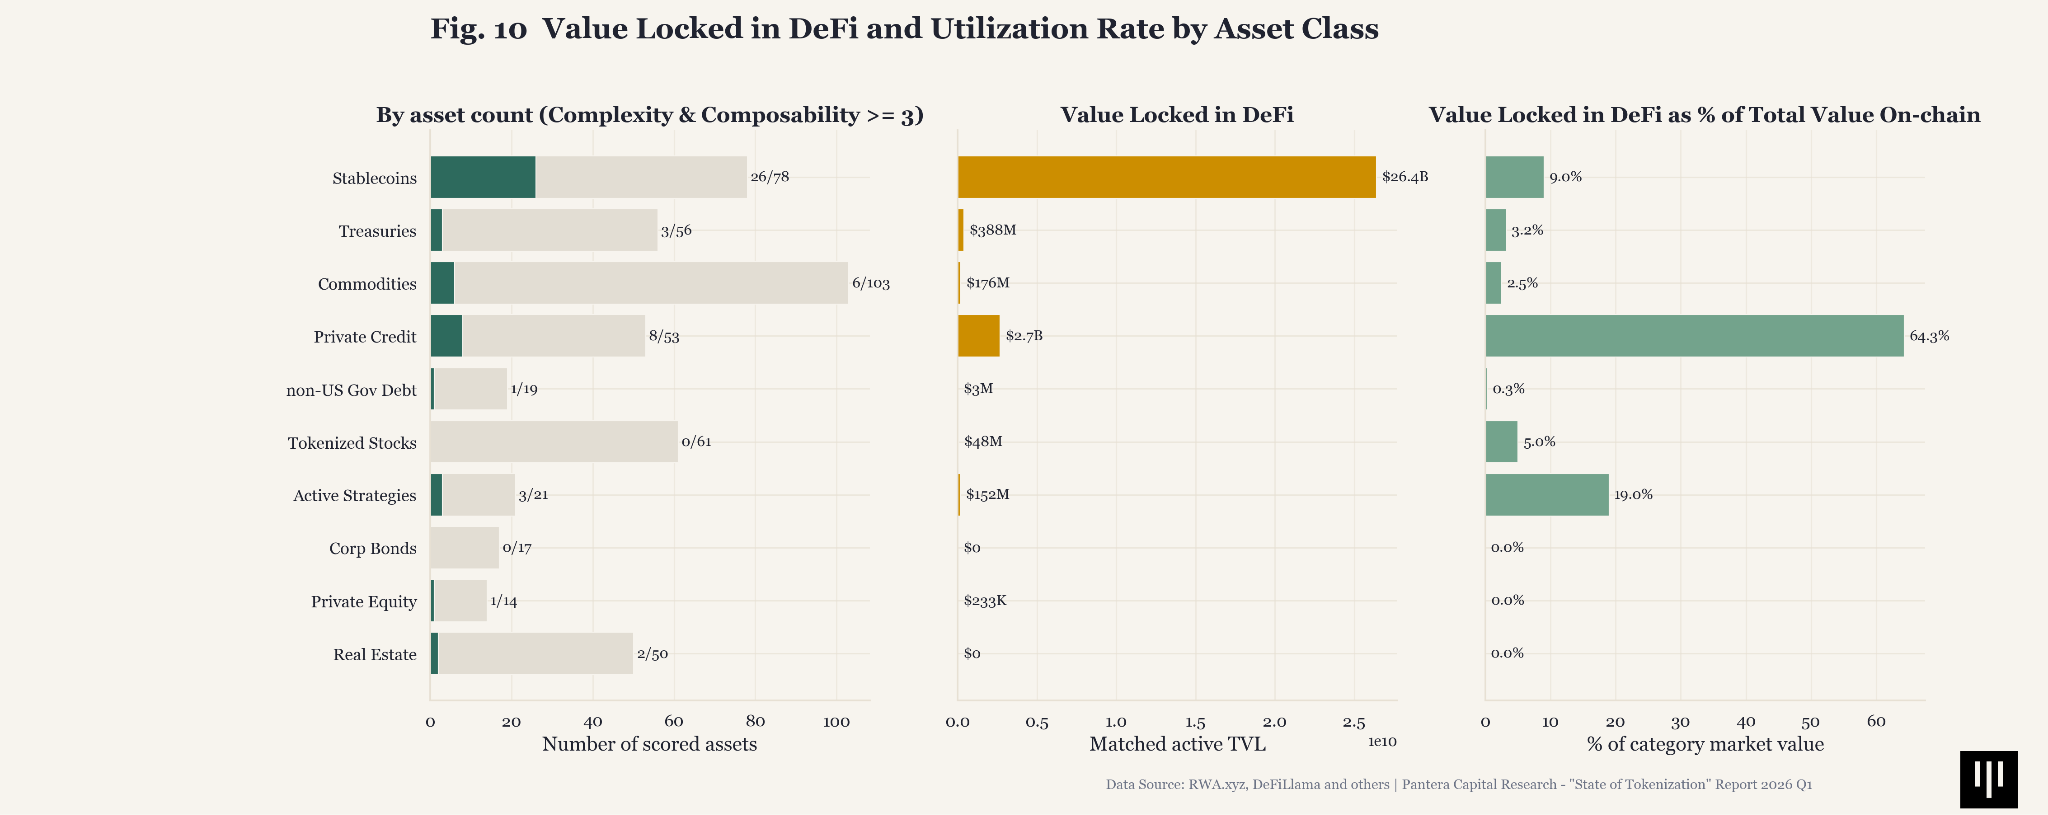
Fig. 10. DeFi composability by asset count and active TVL in DeFi share
5.9 Tokenization Is More Concentrated Than It Looks
Following the discussion above, the tokenization market is more concentrated than it appears. Even when excluding stablecoins, the top 5 issuance platforms account for approximately 50% of all scored assets. Securitize (focused on institutional-grade issuance) leads with $2.7B assets across multiple asset classes, followed by Maple (credit and treasuries), Tether Holdings (gold commodity) and Ondo (multiple asset classes). Platform TPI scores vary significantly: Ondo averages 2.3, Securitize 1.6, and several platforms (Robinhood, MetaWealth) score 1.0 — indicating pure wrapper-level tokenization.
Geographically, including Stablecoins, BVI dominates with $191.5B (out of which $185B is driven by USDT incorporation, which relocated to El Salvador in 2025), followed by Bermuda ($76.1B, 24%) and United States ($23.6B, 7%). Notably, US-domiciled assets average a 2.0 composite TPI, while BVI/Liechtenstein assets (often Reg S offerings) cluster at lower scores. The regulatory environment appears to correlate with the tokenization approach: SEC-regulated products tend toward wrapper patterns, while DeFi-native protocols domiciled in crypto-friendly jurisdictions push toward higher TPI scores.
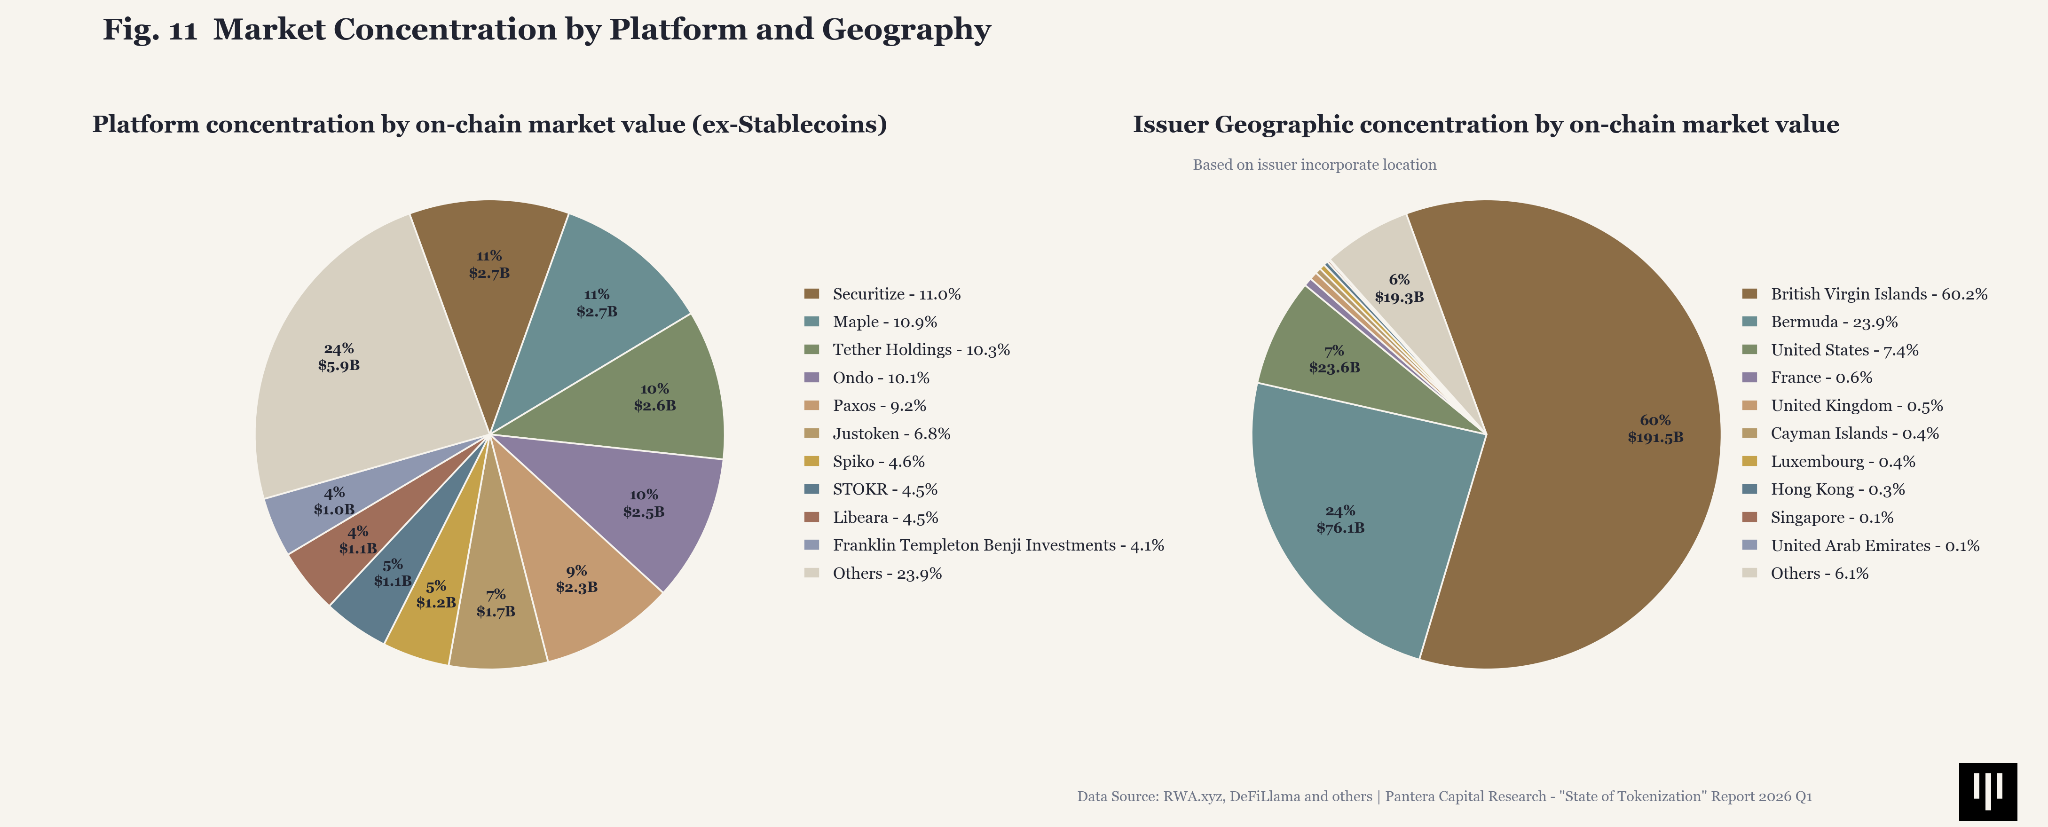
Fig. 11. Market concentration by platform and geography
5.10 TPI Score by Chain: When Permissioned Means Less Native
The current dataset suggests that network architecture matters meaningfully for tokenization progress. Public chains with deeper composability and broader secondary-market functionality tend to score higher on average TPI: Optimism and Base sit near the top of the current sample at roughly 2.6 and 2.5, while Ethereum and Solana cluster around 2.3. By contrast, more operationally constrained environments such as XRP Ledger sit closer to 2.0 in the present dataset.
The Canton Network provides an instructive case study. A permissioned blockchain backed by Digital Asset and used by Goldman Sachs and BNY Mellon, Canton products average a composite TPI of approximately 1.75 — below the market average of 2.04. This is not a failure of execution; it’s a structural consequence of design philosophy and market demand. Institutional-grade permissioning prioritizes compliance and control over on-chain autonomy. Canton validates the thesis that permissioned networks produce lower-maturity tokenization by construction, even when backed by the most sophisticated institutions.
6. The Tokenization Playbook
6.1 Wrap, Connect, Compose, Originate
Most tokenization strategies are architected as cost-reduction programs: compress the back office, shrink the settlement window, automate the reconciliation workflow, and drive the savings to your P&L. That is a legitimate path for activating the benefits of tokenization, but also the narrower one.
The wider path uses tokenization to build new distribution channels and new revenue streams: products that reach global capital pools and investor archetypes that traditional infrastructure cannot efficiently serve.
The TPI framework maps to four phases of this journey. What the framework alone does not show is the strategic inflection point embedded inside it. Phase 1 is a forced cost, not a choice. Phases 2 through 4 are where institutions actually decide what kind of business they are building.
6.1.1 Phase 1: Wrap (TPI 1-2)
Some characterize Phase 1 as the "zero-to-one moment" for institutional tokenization. It’s more accurate to regard it as the v0.1 release: a necessary foundation, but not the product.
The work required to reach Phase 1 is nonetheless sizable. Often issuers cannot ship even a basic wrapper without reconstructing its compliance posture to work with a new asset form. Securities registration, transfer agent arrangements, custody frameworks, KYC/AML workflows, broker-dealer relationships, tax reporting, investor accreditation checks, and disclosure regimes may all need to be re-mapped onto the tokenized instrument. Legal opinions have to be rewritten. Auditors have to be educated. Compliance committees have to sign off on a novel architecture.
This helps explain why 88% of the scored assets in this report still sit in Phase 1.
But Phase 1 is only a foundation. It establishes on-chain presence, but not on-chain utility. The token wrapper functions as a digital receipt whose lifecycle still depends on off-chain infrastructure. The chain improves distribution and visibility at the margin. It does not fundamentally change how the asset works.
The risk of Phase 1 is not failing to reach it. The risk is staying there permanently while the market's center of gravity moves to phases that some Phase 1 architectures cannot reach.
6.1.2 Phase 2: Connect (TPI 2-3)
Phase 2 is where tokenization strategies begin to diverge, and where the most consequential decision in the entire playbook gets made: are you optimizing for cost savings or are you building for new growth?
The cost-savings path treats Phase 2 as an internal efficiency program and describes most institutional tokenization programs in 2026. Dual-ledger systems replace off-chain-only architectures. Whitelist-gated transfers can enable a controlled secondary market. If successful, the institution captures real back-end efficiency gain and reports it as margin expansion. It preserves existing distribution channels, keeps existing client relationships intact, and delivers quantifiable efficiency gains that justify the investment. This is a defensible strategy that helps the average “Head of Digital Assets” earn their keep. But it also has a ceiling.
The growth path treats Phase 2 as a new platform layer for reaching and creating net-new markets. Oracle integration, basic smart-contract governance, and progressive loosening of on-chain transferability are not internal efficiencies. They expand distribution to new customers and introduce the tokenized assets to new capital pools, serving as the preconditions for composability in Phase 3. The instruments that emerge from this path are designed from day one to be accepted as collateral in on-chain lending protocols like Morpho, integrated into DeFi yield vaults, and referenced by automated market makers like Uniswap.
6.1.3 Phase 3: Compose (TPI 3-4)
Composability is the threshold at which a tokenized asset becomes a financial building block. It can be posted as collateral in Morpho or other on-chain lending protocols. It can be allocated into risk-managed vaults curated by firms like Gauntlet or Steakhouse. It can be integrated into structured products that combine with other on-chain assets to produce yield profiles that do not exist in traditional markets. The asset evolves from being held on-chain to being actively used on-chain.
The data in this report already shows where this is happening. Private Credit sits at 64.3% DeFi utilization, led by Maple's syrupUSDT and syrupUSDC, which are yield-bearing instruments designed from issuance to be accepted as collateral and looped through multiple vault layers. Active Strategies reached 19.0%, led by Superstate Crypto Carry Fund and their Short Duration US Government Securities Fund. These are the result of issuers who architected their tokenized products for composability from the start, accepted the compliance re-engineering burden, and are now earning distribution that Phase 1 and Phase 2 assets cannot reach. Only 12% of the market has reached Phase 3. That is both the measure of how hard it is and the measure of how wide the moat becomes once an issuer crosses it.
Phase 3 is also where a new distribution channel appears that was not available in traditional finance: the on-chain capital base. Stablecoin balances held by DeFi-native investors, DAO treasuries, crypto-native funds, and protocols with idle capital represent a pool of capital that does not meaningfully participate in traditional capital markets. That capital is reached through composability, not through broker-dealer networks or institutional sales teams. An issuer whose asset achieves composability gets access to this pool. An issuer whose asset is stuck at Phase 1 or Phase 2 does not.
However, the same composability that makes tokenized assets more useful on-chain can also create new channels for contagion. Recent market stress around the KelpDAO hack highlighted how concerns about collateral quality, bridge security, and pooled-collateral design in major lending markets can trigger rapid risk-off behavior and TVL contraction. The lesson is not that composability should be avoided, but that deeper composability raises the standard for risk management. As tokenized assets become more widely accepted as collateral, the market will need stronger collateral transparency, better isolation frameworks, real-time monitoring, and clearer stress-testing practices.
6.1.4 Phase 4: Originate (TPI 4-5)
Phases 1 through 3 take an existing off-chain asset and progressively migrate its lifecycle on-chain. Phase 4 starts on-chain. Issuance, redemption, custody, settlement, and governance are designed as on-chain primitives from day one. Permissionless mint and burn. On-chain sovereign ledger. Autonomous risk engines, liquidation cascades, and governance operating without human intermediaries.
Today, only DeFi-native protocols fully occupy this tier — MakerDAO's USDS, Aave's GHO, a handful of others. These examples can feel distant from institutional tokenization. The relevant question for today’s Head of Digital Assets is not whether you will launch the next USDS. It is how the evolution from today's wrappers to tomorrow's natively originated products will happen, what will power that transition, and where the competitive pressure will come from.
Consider how a product like BlackRock's BUIDL might evolve from its current form. BUIDL today is a tokenized share class of an off-chain money market fund. Shares are minted by an administrator, redeemed T+1 through a transfer agent, and transfer is restricted to whitelisted addresses. That is a Phase 1 wrapper. A Phase 2 version of the same product relaxes transfer restrictions among a broader set of qualified investors and shortens the redemption window. A Phase 3 version makes the token collateral-eligible in Morpho, with real-time oracle pricing and integrated risk-manager coverage: still administratively issued, but productive on-chain. Each of these steps is critical to informing the product roadmap.
A Phase 4 version of that same product no longer has an off-chain master ledger. The tokenized share is the share. Interest accrues per block rather than being distributed monthly. Fund products rebalance across underlying instruments programmatically based on yield curves and liquidity signals. Compliance is enforced by the token itself at every transfer, not by an ex-post-facto review post-processing. At that point, the tokenized money market funds that we see today are still the same asset in economic substance, but a new kind of instrument in structural form: continuously settling, permissionlessly composable, and operating as both an investment vehicle and a DeFi primitive.
The same logic applies across asset classes:
- Tokenized Treasuries, today wrappers around short-duration dollar products, can evolve into on-chain yield instruments where coupon accrual, principal management, and secondary liquidity are native functions. At Phase 4, duration and coupon components can be separated and traded independently, as products that are economically similar to Treasury strips, but structurally impossible without programmable infrastructure.
- Tokenized Private Credit, already the most composable non-stablecoin category, can evolve toward native origination where loan books are underwritten and managed directly on-chain, with programmatic tranching, autonomous collateral management, and continuous mark-to-market transparency replacing quarterly NAV reporting.
- Tokenized Corporate Bonds, still early in wrapper form, can evolve into instruments where coupon payments stream to holders continuously, covenant enforcement runs as smart-contract logic, and default triggers execute without a trustee. The underlying credit risk is identical, but the operational infrastructure is categorically different.
Phase 4 is not a separate universe to be entered after Phase 3 is complete. In fact, Phase 4 is where stablecoins largely exist today. It is the logical endpoint of the growth path described in Phase 2. An institution that is engineering for composability in Phase 2, executing on DeFi integration in Phase 3, and building relationships with on-chain risk managers along the way is already building the architectural foundation that Phase 4 requires. An institution that is optimizing its tokenization program purely for back-office cost savings is not. The gap between the two will compound over the next three to five years, and by the time it becomes obvious in the market, the decisions that determined the outcome will have been made years earlier.
7. Conclusion & Outlook
The industry has successfully proven that assets can be represented on-chain, but it has not yet proven that on-chain representation fundamentally changes how those assets function. The gap between tokenization announcements and true tokenization maturity remains wide.
The next phase of market maturation will be defined not by how much value is tokenized, but by utility metrics and real demand:
- How quickly does settlement actually occur, measured in milliseconds?
- How low is the transfer cost relative to the dollar value moved?
- How many on-chain wallets hold the asset?
- How much daily transfer and trading volume does it generate?
- How much value is actively deployed in DeFi?
The institutions that invest in real infrastructure depth — autonomous issuance, on-chain primary ledgers, and protocol-level composability — will build the moats that define the next wave of genuine utility and demand.
7.1 Tokenization Should Be Measured by Outcomes, Not Just Packaging
A central lesson of this report is that tokenization should not be judged by whether an asset has been placed on a blockchain, but by whether it actually delivers the benefits that blockchain infrastructure was meant to provide. The original promise of asset tokenization was straightforward: assets that can move and settle 24/7, operate across borders, reduce operational friction, lower intermediation costs, and broaden access for both retail and institutional investors.
The market has made real progress in representation and distribution, but the data shows that much of tokenization still stops short of those goals. Many products are on-chain in form, but not yet in function. The right question is no longer simply whether an asset is tokenized, but how much of its lifecycle has truly become continuous, programmable, and natively on-chain.
7.2 The Most Valuable Use Cases Require Redesign, Not Replication
Many current tokenized products still mirror traditional market structure too closely. That limits the gains. In some use cases, the point of tokenization is not simply to recreate an existing off-chain workflow on a blockchain, but to remove the need for parts of the workflow altogether. Escrow is a good example. If funds can be held and conditionally released by credible smart-contract infrastructure, then tokenization should do more than create a digital version of escrow; it should reduce reliance on the layers of intermediation that escrow historically required. More broadly, the market still needs to move from on-chain wrappers around traditional processes toward structures designed around what blockchains do uniquely well: programmability, atomic settlement, continuous markets, and shared state.
7.3 The Wrapper Market Is Not a Bug — It's a Regulatory Equilibrium
Part of this is by design. In many cases, today's wrapper-stage products reflect what current customers, issuers, and regulators actually want: familiar structures, tighter controls, and incremental efficiency gains in distribution and settlement. The 91% of assets still gated at issuance and redemption are not simply lagging behind — they are the rational output of a market where compliance still assumes intermediary-controlled processes. When the rules governing securities issuance, custody, and redemption are built around licensed entities acting as gatekeepers, issuers default to admin-controlled minting and custodian-mediated exits because that is what keeps them within the regulatory perimeter.
The geographic data reinforces this: US-domiciled assets average a 2.0 composite TPI, and SEC-regulated products tend toward wrapper patterns, while DeFi-native protocols domiciled in more permissive jurisdictions push toward higher scores. Regulation is not just slowing tokenization down — it is actively shaping what kind of tokenization gets built. As long as the rules assume intermediary-gated workflows, even the most sophisticated institutional issuers will keep producing Tier 1 wrappers, regardless of how much capital or engineering talent they deploy. The infrastructure bottleneck and the regulatory bottleneck are not separate problems; they are the same constraint expressed at different layers of the stack.
7.4 Better Distribution Does Not Create Demand for a Weak Asset
Blockchain can lower barriers to access, improve portability, and expand global distribution, but it cannot manufacture demand where none exists. Some tokenized products appear to be built around the assumption that putting an asset on-chain will make it more investable by default. That is unlikely to hold. If the underlying asset is unattractive, illiquid, or structurally weak off-chain, tokenization alone will not solve the problem. In that sense, tokenization is best understood as a distribution and infrastructure upgrade, not as a substitute for asset quality. The strongest tokenized products will be those where both pieces are present: a compelling underlying asset and a materially better on-chain user experience.
7.5 Opaque Asset Classes Could Benefit the Most from On-Chain Transparency
Some of the most interesting long-term opportunities may lie in markets that remain structurally opaque in traditional finance. Corporate bonds are a strong example. They are still early in tokenized form, but they are worth watching closely because the underlying market is fragmented, difficult to analyze, and historically vulnerable to information gaps. The same logic extends to parts of private credit, where periodic concerns about valuation, quality, and concentration are difficult to resolve in systems with limited transparency. Tokenization will not remove credit risk, but it can make the surrounding infrastructure more legible. If issuance, ownership, transfer activity, collateral state, and even elements of credit reporting become more transparent on-chain, tokenization could contribute not only to efficiency, but to a more robust and observable financial system.
7.6 The “Perpification” vs Tokenization Debate
Some discussion in the industry frames perpetuals and tokenization as competing paths for bringing traditional assets on-chain. That framing is too narrow. Perpetuals are not a replacement for tokenization; they are a different form of financial representation that serves different users, risk preferences, and market functions. Tokenization modernizes the spot layer by putting ownership claims, settlement, and transfer on-chain. Perpetuals modernize the derivatives layer by enabling continuous, leveraged, cash-settled exposure without requiring the holder to own the underlying asset itself. In the near term, the two can appear to compete because many early adopters are traders. But structurally, they are better understood as complementary rather than substitutive.
A more useful lens is that both tokenization and perpetuals are helping modernize the capital markets stack and, together, may enable the unbundling of assets into their underlying economic components. Perpetuals separate price discovery from ownership and shareholder rights. Tokenization, by contrast, preserves a claim on the underlying asset while improving programmability and transferability. In combination with prediction markets and other crypto-native primitives, these instruments could make it possible to trade increasingly specific forms of exposure: not just broad asset classes, but selected cash flows, business lines, or risk factors. That is a much broader shift than simply asking whether “perpification” is better than tokenization.
At the same time, the rise of perps tied to real-world exposures is a genuine trend worth monitoring. We are already seeing early examples of assets, especially commodities, being “perpified” through mechanisms such as HIP-3. We’ve also seen Ondo pushing out Ondo Perps that are coming soon besides their Global Markets product. So the signal is clear that perpetuals will not replace tokenized spot assets, but the market is likely expanding in both directions at once: tokenization for ownership and settlement, and perpetuals for liquid, always-on, leveraged price exposure.
8. Final Thoughts
If tokenization today is still in its newspaper-on-a-website phase, the more important question is what pushes it beyond that stage. The internet did not stay in the copied-article era. Three forces drove the evolution from digitized print to native formats: distribution rails became always-on, native interaction primitives emerged, and the cost of production collapsed. What followed was not a faster newspaper, but entirely new product categories — podcasts, algorithmic feeds, live streams, creator platforms, real-time marketplaces — that had no print analog and could not have existed in the prior medium.
The equivalent forces are already acting on tokenization. Atomic settlement and 24/7 liquidity are the “always-on” shift. Smart contracts and composability are the native interaction primitives. Permissionless issuance is the collapse in production cost — the structural move from “only registered issuers can originate securities” toward a world where anyone can deploy financial logic on-chain. These are not incremental improvements to existing products; they are the preconditions for products that cannot exist as wrappers. What does that world look like? Financial instruments that unbundle the forced bundles of traditional finance, so that credit risk, duration exposure, coupon income, and governance rights can be separated, priced, and traded independently. Collateral that rebalances in real time without a human operator in the loop. Compliance logic embedded in the asset itself, with jurisdiction and transfer restrictions executed as code rather than enforced manually at the edge. Yield streams that optimize autonomously across lending protocols, liquidity pools, and staking venues. Governance rights that can be delegated, sold, or activated conditionally. Entirely new asset classes backed by previously uninvestable cash flows. None of this can be wrapped in off-chain originals but has to be originated on-chain.
We will continue to update the Tokenization Progress Index as the market evolves. The portal provides real-time access to the underlying data. We welcome feedback from practitioners who are building in the space — the framework improves with every edge case. If anyone is interested in deeper dataset downloads or wants to share feedback on the framework, please reach out to the research team:
- Franklin Bi — franklin@panteracapital.com
- Ally Zach — ally@panteracapital.com
- Danning Sui — danning@panteracapital.com
We thank Yiran Tao, Reid Yager, Carlos Gonzalez Camp, Meta from DeFiLlama, Manuel from SeaLaunch., JW Seo and Nexus Data Labs, Filippo Armani, Francis Gowen, Jeff Lucia and Derrick Cui for their early comments and reviews.
We also thank James Callan, Raymond Yu, and Ping Chen from Pantera for their editorial feedback and support.
Investment Disclaimer
This document is made available by Pantera Capital Partners LP (“Pantera”) for informational and educational purposes only. It does not contain all information pertinent to an investment decision. Nothing in this document constitutes an investment recommendation or an offer of investment advisory services. This document cannot be relied upon in making an investment decision. Nothing contained herein constitutes an offer to sell, or a solicitation to buy, any securities. This document contains information believed to be reliable, and has been obtained from sources believed to be reliable, but no representation or warranty is made (express or implied) of any nature, nor is any responsibility or liability of any kind accepted, with respect to the fairness, accuracy, completeness, or reasonableness of the information or opinions contained herein. Forward-looking statements should not be relied upon. There is no guarantee that investments in any instrument described herein will be profitable – all investments carry the inherent risk of total loss. Analyses and opinions contained herein (including market commentary, statements or forecasts) reflect the judgment of the author as of the date this document was published, and may contain elements of subjectivity (including certain assumptions) or be based on incomplete information. There is no duty or obligation to update the contents of this document. This document is not intended to provide, and should not be relied on for accounting, legal, or tax advice, or investment recommendations. Pantera and its principals have made investments in some of the instruments discussed in this communication and may in the future make additional investments or trading decisions in connection with such instruments without further notice. This document solely reflects the opinion of the author, and does not reflect Pantera’s opinions.
9. Appendix
- Please see important disclaimers at the end of this report.↩︎
- TPI scores are intended solely to assess the technical and structural maturity of tokenization and do not represent an opinion on the investment merit, valuation, or performance prospects of any underlying asset or investment.↩︎
- data are aggregated and sourced from DeFillama and RWA.xyz. Please see the data section for more details.↩︎
- Any asset examples presented in this report are for illustrative purposes only and should not be construed as investment advice or a recommendation to buy or sell any security or token.↩︎
The author of this report may have personal holdings or financial interests in assets or tokens discussed herein. However, the author affirms that no transactions have conducted using material non-public information obtained in the course of research or drafting. This report is intended solely for general information purposes and does not constitute legal, business, investment, or tax advice. It should not be used as a basis for making any investment decisions or as guidance for accounting, legal, or tax matters. Any references to specific assets or securities are made for informational purposes only and should not be construed as an offer, solicitation, or recommendation to invest. The opinions expressed herein are those of the author and may not reflect the views of any affiliated institutions, organizations, or individuals. The opinions and analyses expressed herein are subject to change without prior notice. In addition, beyond the individual disclosures included in each report, Four Pillars, may hold existing or prospective investments in some of the assets or protocols discussed herein. Furthermore, FP Validated, a division of Four Pillars, may already be operating as a node in certain networks or protocols discussed herein or may do so in the future. Please see below links in the footer for FP Validated's participating network disclosures and for broader disclosure details.


